DM Distribution compares distributions of demographic variables across treatment arms via a one-way ANOVA or contingency analysis.
Running this report with the Nicardipine sample setting and default options generates the output shown below. Refer to the DM Distribution requirements description for more information.
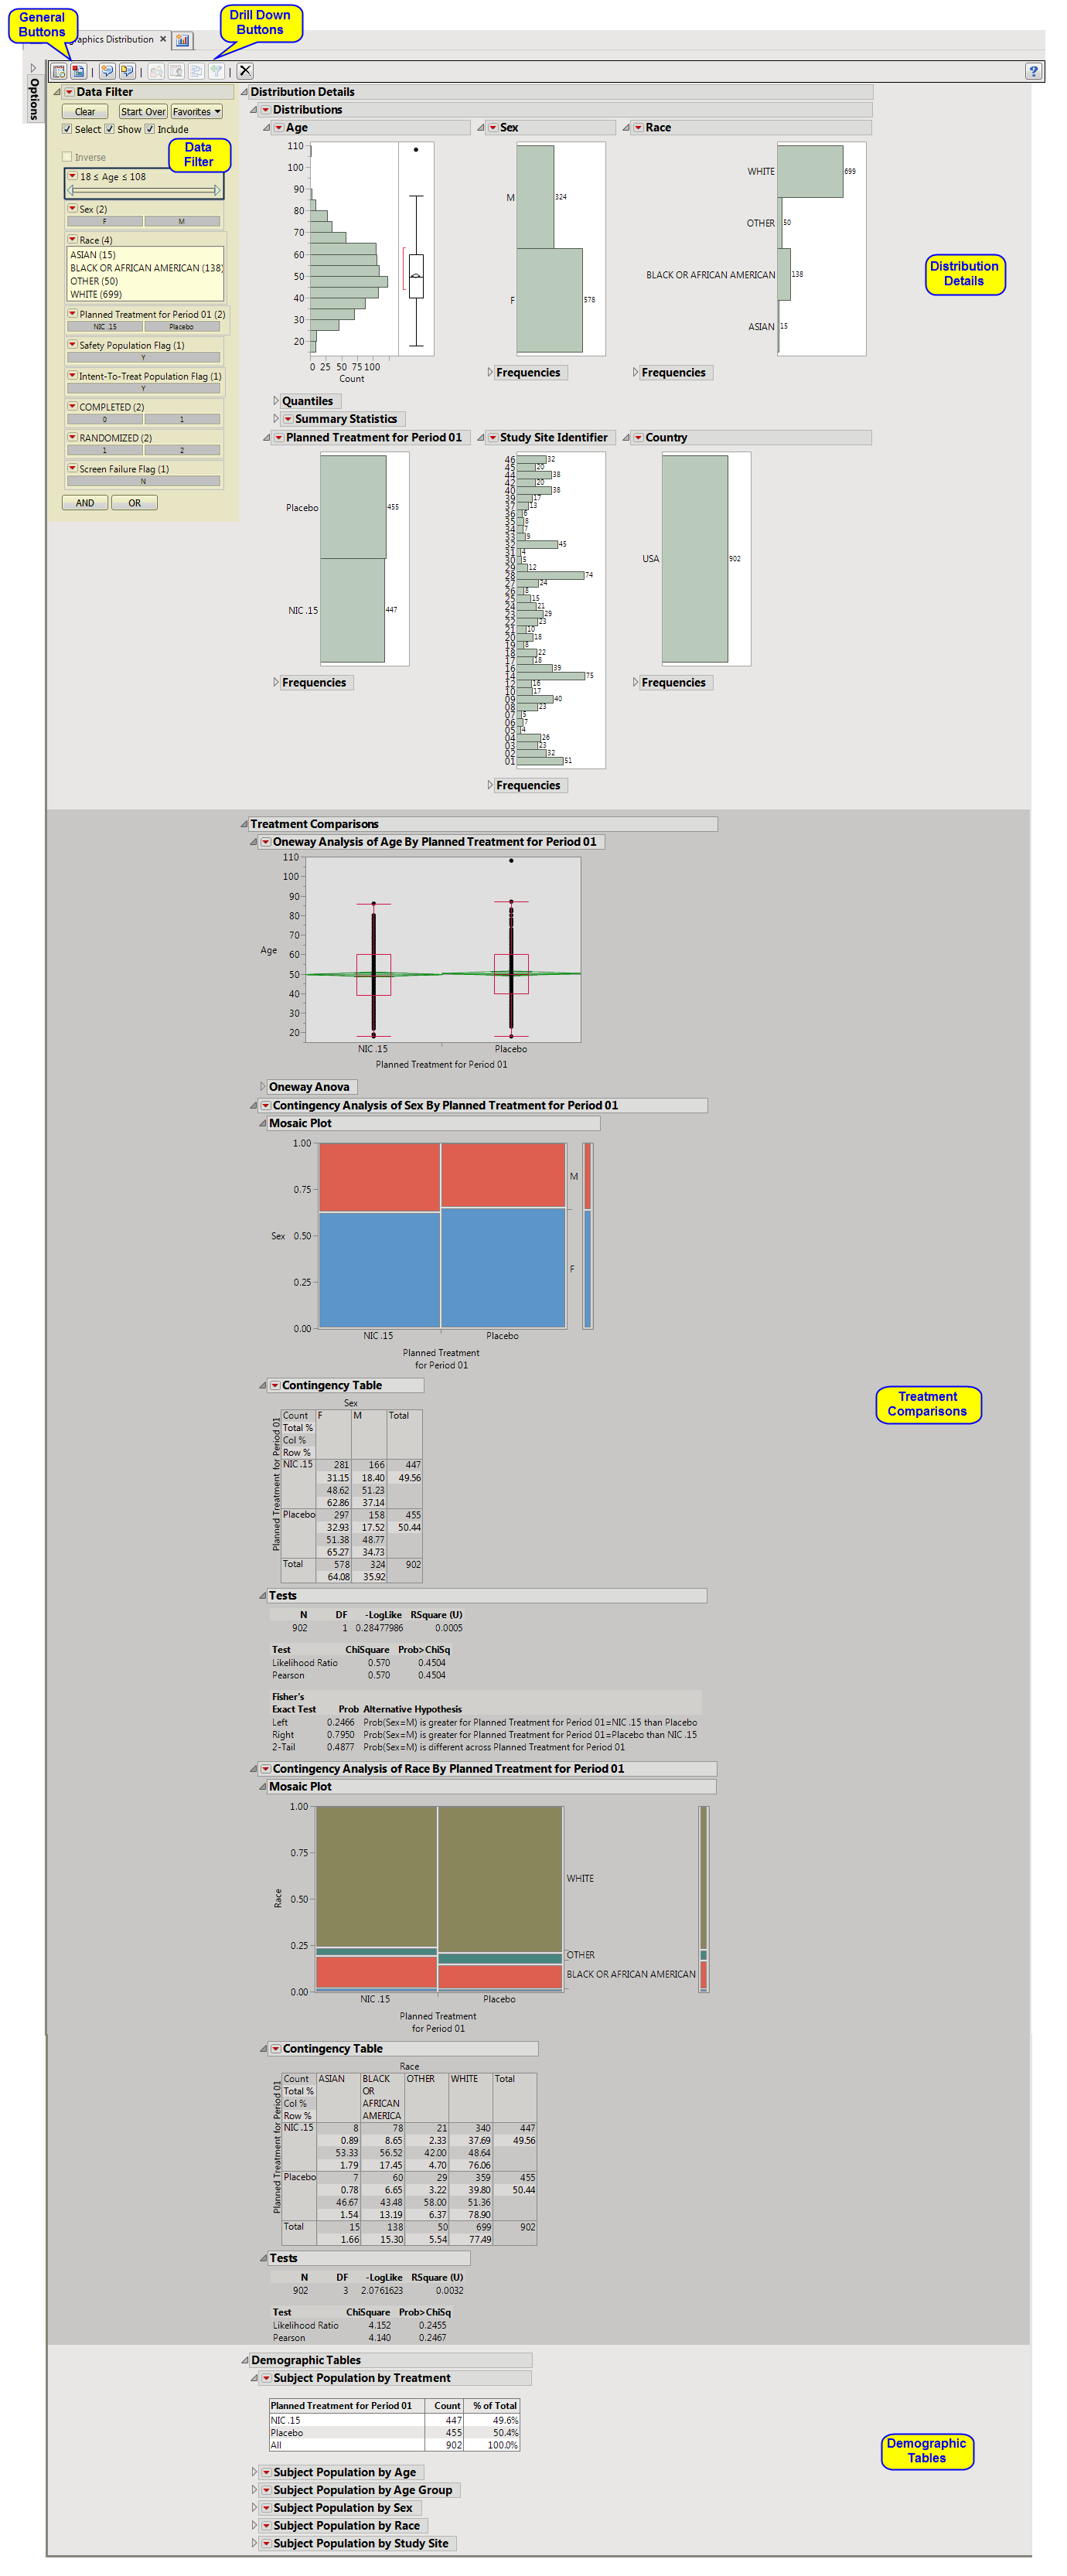
The DM Distribution report initially shows Distribution Details, Treatment Comparisons, and Demographic Tables. Use the available options to -down into the data.
This enables you to subset subjects based on demographic characteristics and treatment. Refer to Data Filter for more information.
|
•
|
Profile Subjects: Select subjects and click
|
|
•
|
Show Subjects: Select subjects and click
|
|
•
|
Cluster Subjects: Select subjects and click
|
|
•
|
Demographic Counts: Select subjects and click
|
|
•
|
Click
|
|
•
|
Click
|
|
•
|
Click
|
|
•
|
Click
|
|
•
|
Click the arrow to reopen the completed report dialog used to generate this output.
|
|
•
|
Click the gray border to the left of the Options tab to open a dynamic report navigator that lists all of the reports in the review. Refer to Report Navigator for more information.
|