Mortality Time-to-Event groups clinical mortality results by treatment arm and generates Kaplan-Meier survival curves with associated statistics.
Running this report for Nicardipine using default settings generates the report shown below.
|
•
|
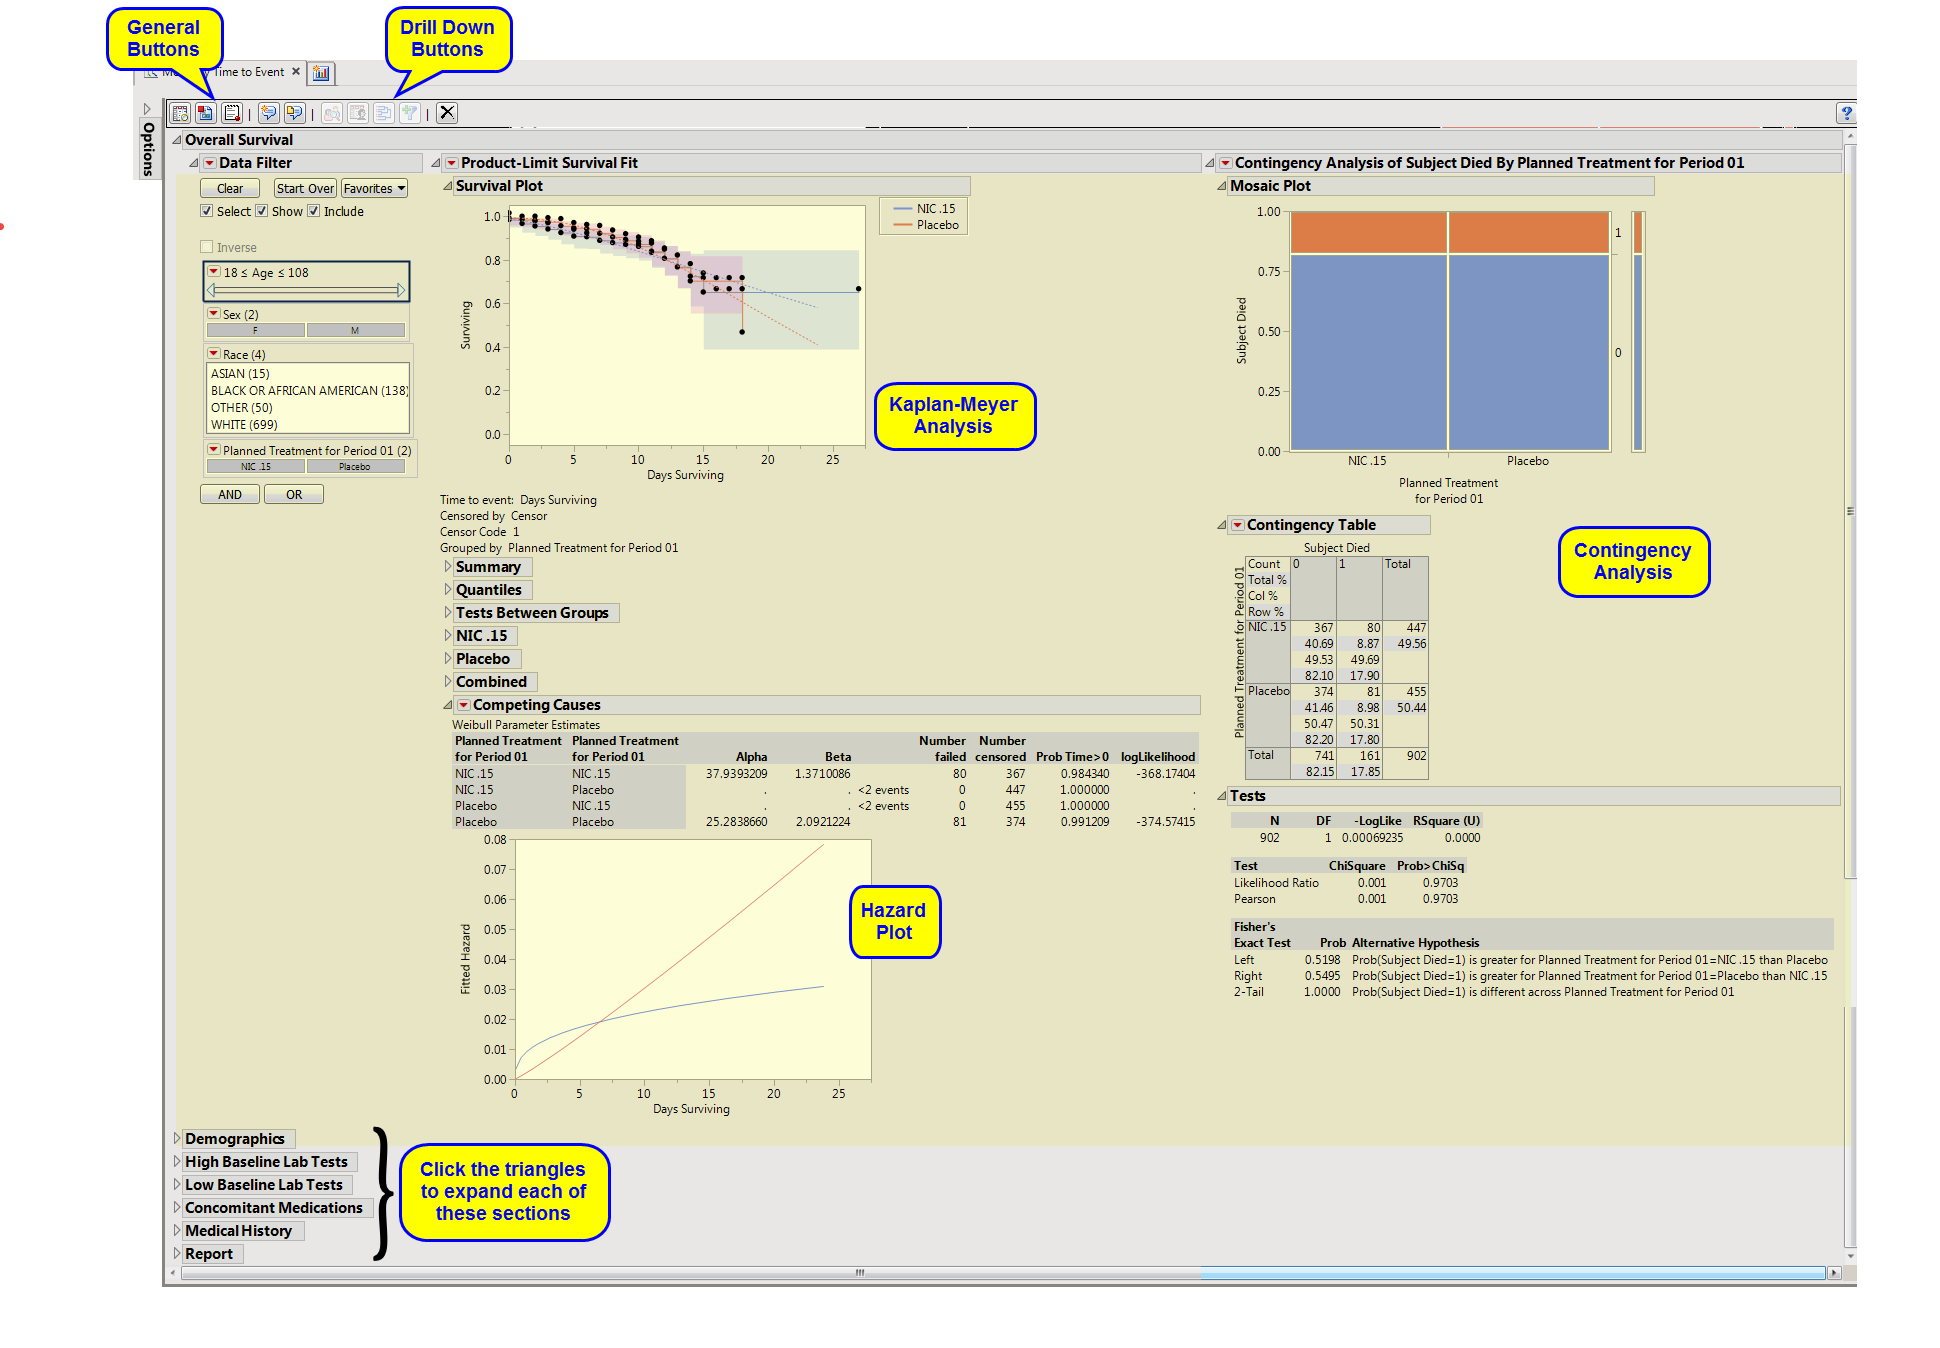
Overall Survival: This tab contains a Kaplan-Meier time-to-event analysis as well as a Contingency Table of treatment versus death, a Hazard curve, and a Data Filter.
|
|
•
|
Demographic (Mortality Time to Event): This tab displays Hazard Ratio Estimate Plots for each demographic subgroup.
|
|
•
|
High Baseline Lab Test: This tab displays Hazard Ratio Estimate Plots for subjects showing abnormally high lab test results at baseline.
|
|
•
|
Low Baseline Lab Test: This tab displays Hazard Ratio Estimate Plots for subjects showing abnormally low lab test results at baseline.
|
|
•
|
Concomitant Medications: This tab displays Hazard Ratio Estimate Plots for any concomitant medications subjects are taking at baseline.
|
|
•
|
Medical History: This tab displays Hazard Ratio Estimate Plots for subjects’ medical history events at baseline.
|
|
•
|
Report: This section presents the data used to generate the graphs in each of the other sections in tabular form.
|
|
•
|
Profile Subjects: Select subjects and click
|
|
•
|
Show Subjects: Select subjects and click
|
|
•
|
Cluster Subjects: Select subjects and click
|
|
•
|
Demographic Counts: Select subjects and click
|
|
•
|
Click
|
|
•
|
Click
|
|
•
|
Click
|
|
•
|
Click
|
|
•
|
Click the arrow to reopen the completed dialog used to generate this output.
|
|
•
|
Click the gray border to the left of the Options tab to open a dynamic report navigator that lists all of the reports in the review. Refer to Report Navigator for more information.
|