The AE Severity ANOVA report screens all adverse events by performing a mixed-model analysis of variance, with average ranked severity score as the dependent variable and customizable fixed and random effects. A separate ANOVA is fit for each distinct adverse event. Volcano plots and other output enable efficient screening of adverse event severities that differ between treatment groups. If a patient has multiple instances of a particular adverse event, then those scores are averaged to form a single score for analysis.
Running this report for Nicardipine using default settings generates the report shown below.
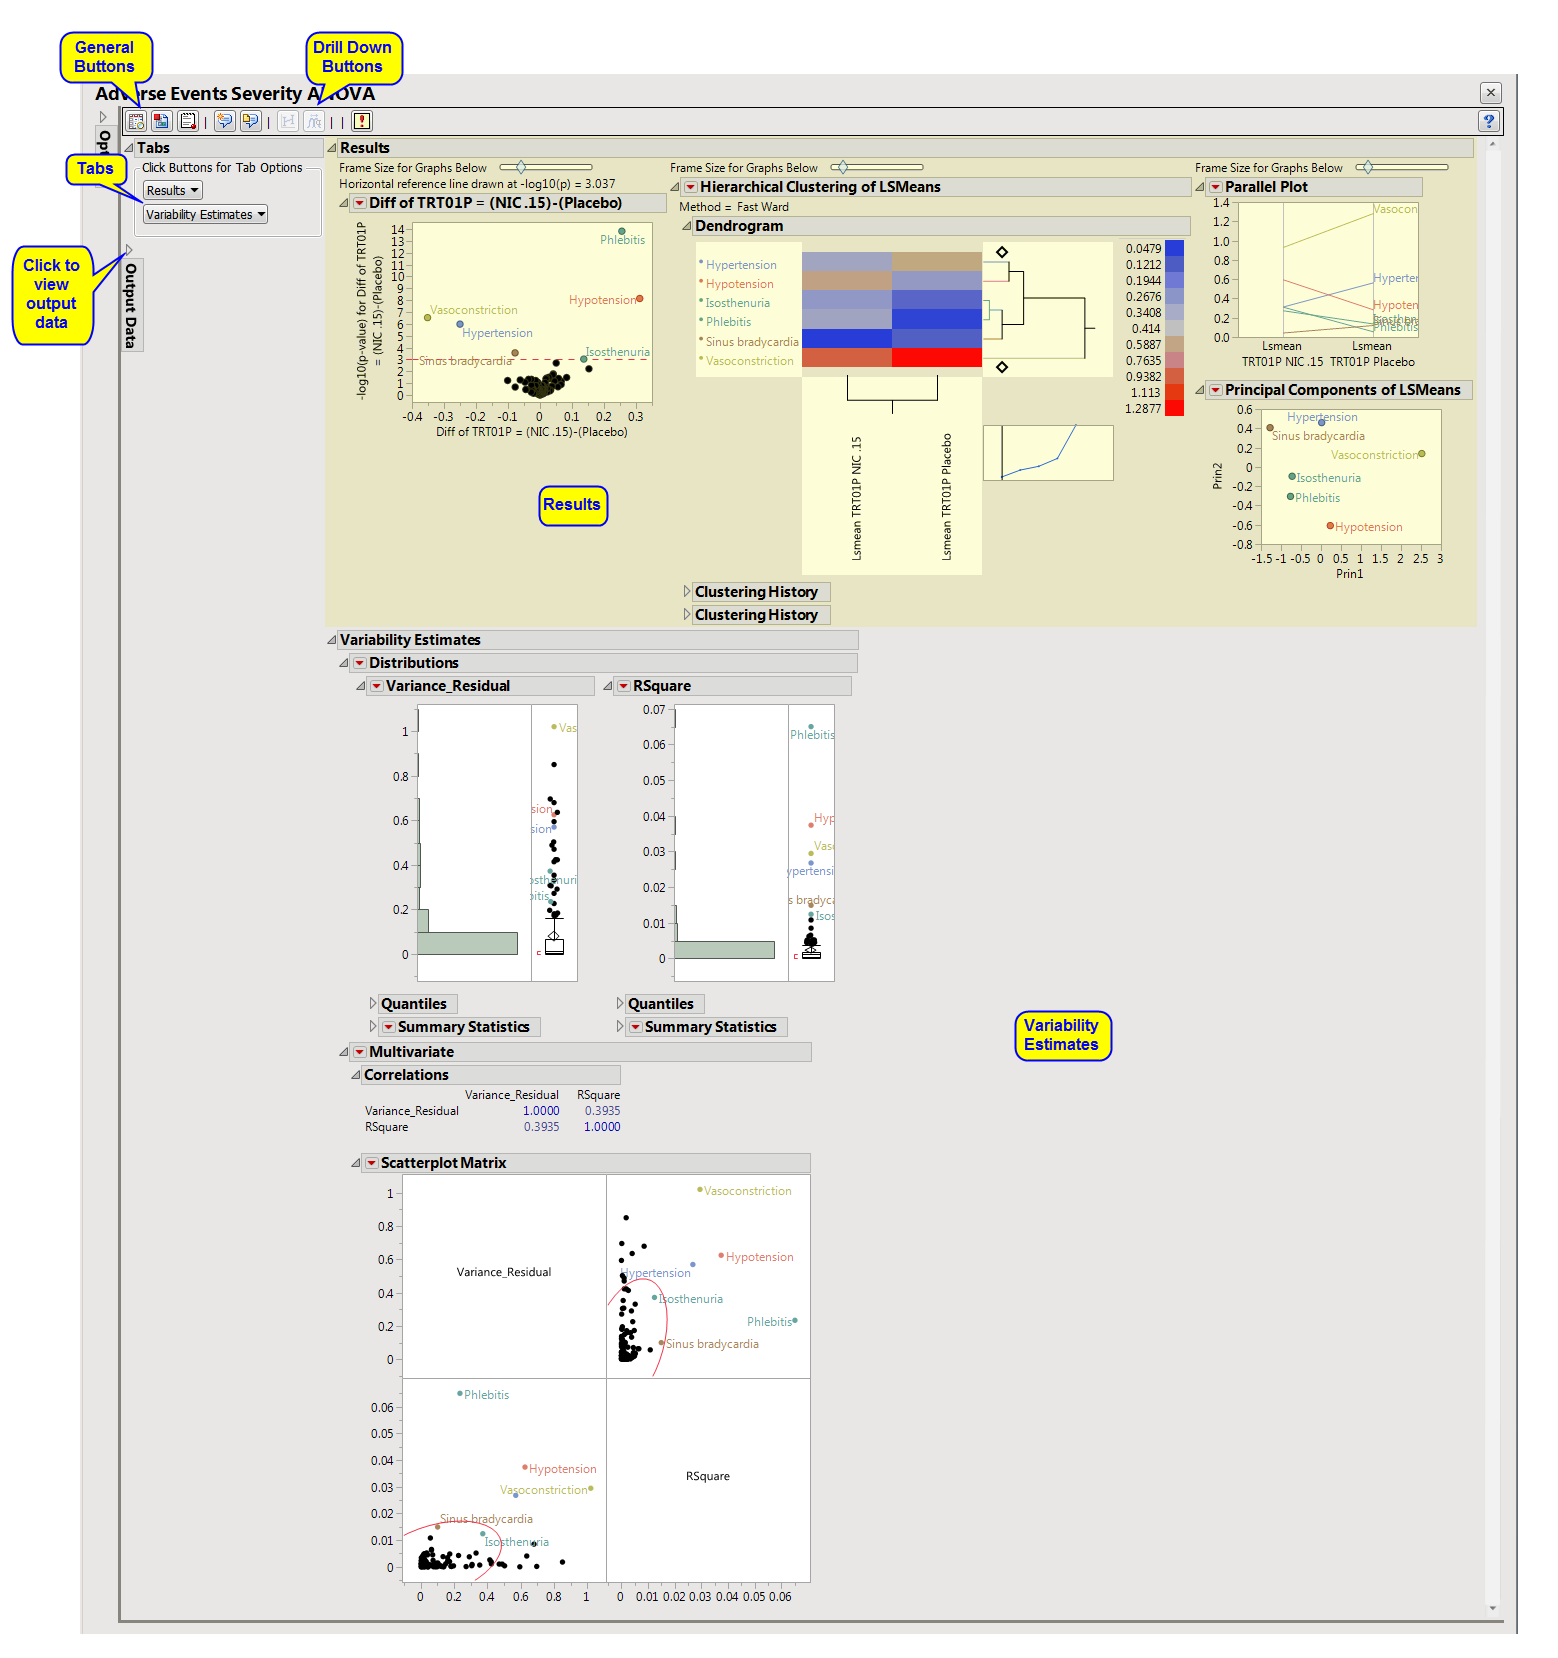
The Results window contains the following elements:
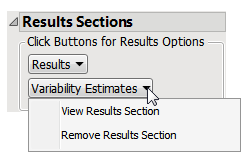
This pane enables you to access and view the output plots and associated data sets on each tab. Use the drop-down menu to view the section in the Results pane or remove the section and its contents from the Results pane.
|
•
|
Results: This tab shows the primary results from the analysis, including Volcano Plots and various analyses on least squares means.
|
|
•
|
Variability Estimates (AE Severity ANOVA): This tab shows the analyses on variance component estimates from the ANOVA model fits.
|
|
•
|
Fit Model and Plot LS Means: Select points or rows and click
|
|
•
|
Construct One-way Plots: Click
|
|
•
|
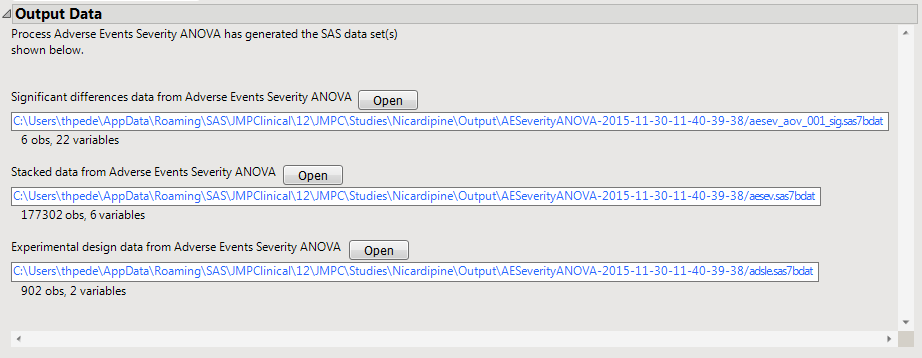
Significant Differences Data Set: This output data set contains a complete list of the adverse events significant by one or more criteria. This data set is indicated by the _sig suffix. Click to view the data set.
|
|
•
|
Stacked Significant Differences Data Set: This output data set contains a complete list of all adverse events for all subjects. It is typically very tall.
|
|
•
|
Experimental Design Data Set: This is a SAS data set that provides information about the columns of a tall data set. It describes relevant experimental variables such as treatment conditions and covariates as well as a variable named ColumnName. Refer to The Example Data for more information. Click to view the data set.
|
|
•
|
Click
|
|
•
|
Click
|
|
•
|
Click
|
|
•
|
Click
|
|
•
|
Click the arrow to reopen the completed report dialog used to generate this output.
|
|
•
|
Click the gray border to the left of the Options tab to open a dynamic report navigator that lists all of the reports in the review. Refer to Report Navigator for more information.
|
Note: For information about how treatment emergent adverse events (TEAEs) are defined in JMP Clinical, please refer to How does JMP Clinical determine whether an Event Is a Treatment Emergent Adverse Event?.