The AE Time to Event report screens all adverse events by performing log-rank and Wilcoxon tests between treatment groups. The time to first occurrence of the adverse event is used as the response.
Running this report with the Nicardipine sample setting generates the tabbed Results window shown below. Refer to the Profile Subjects requirements description for more information.
The Report window contains the following:
|
•
|
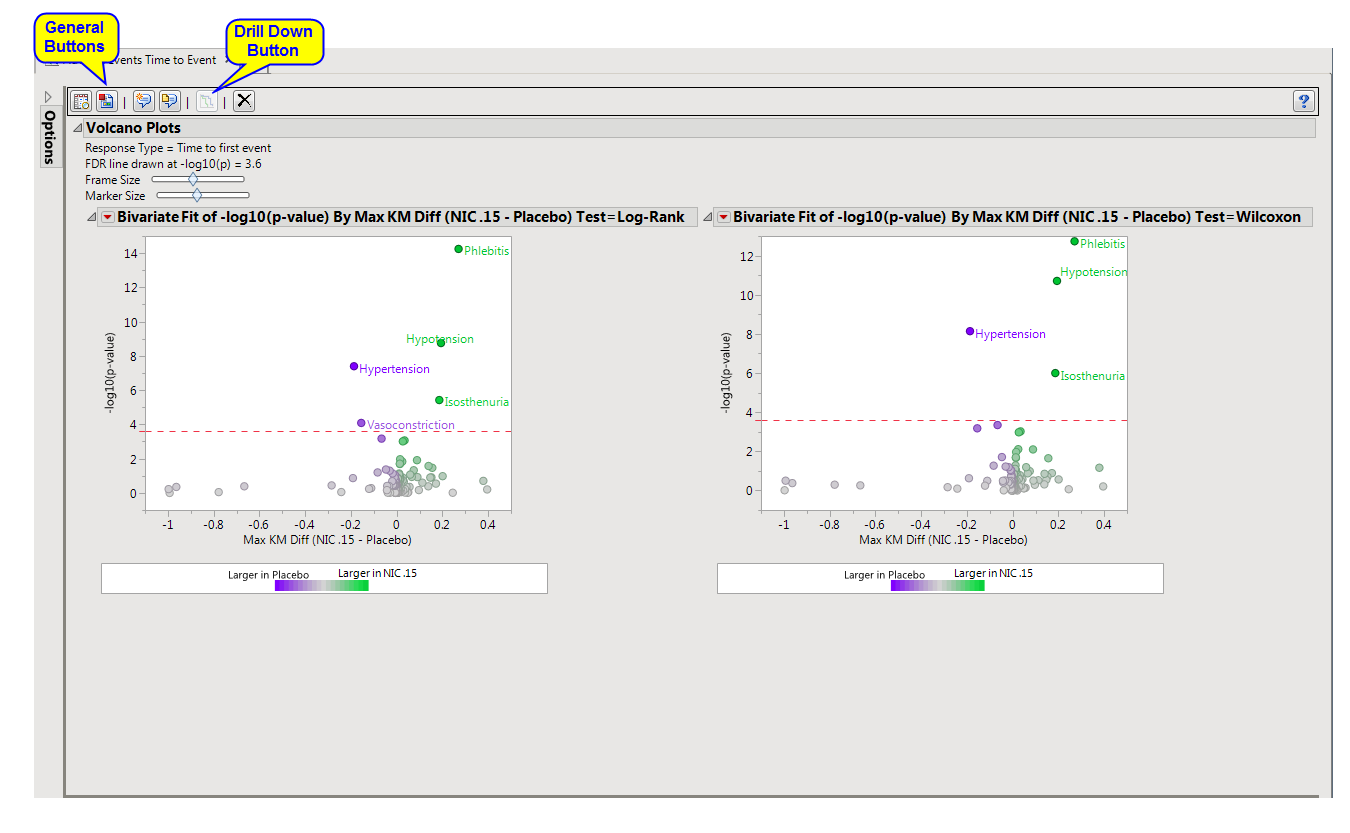
Volcano Plots: Presents summary figures for two popular statistical tests for Kaplan-Meier analyses: the Log-Rank and Wilcoxon.
|
|
•
|
Kaplan-Meier and Hazard Plots: Click
|
|
•
|
Fit Incidence Density Model: Click
|
|
•
|
Click
|
|
•
|
Click
|
|
•
|
Click
|
|
•
|
Click
|
|
•
|
Click the arrow to reopen the completed report dialog used to generate this output.
|
|
•
|
Click the gray border to the left of the Options tab to open a dynamic report navigator that lists all of the reports in the review. Refer to Report Navigator for more information.
|
Note: For information about how treatment emergent adverse events (TEAEs) are defined in JMP Clinical, please refer to How does JMP Clinical determine whether an Event Is a Treatment Emergent Adverse Event?.