Running Rick Based Monitoring for the Nicardipine study generates the tabbed Results window shown below. Output from the report is organized into sections. Each tab contains one or more plots, data panels, data filters, or other elements that facilitate your analysis.
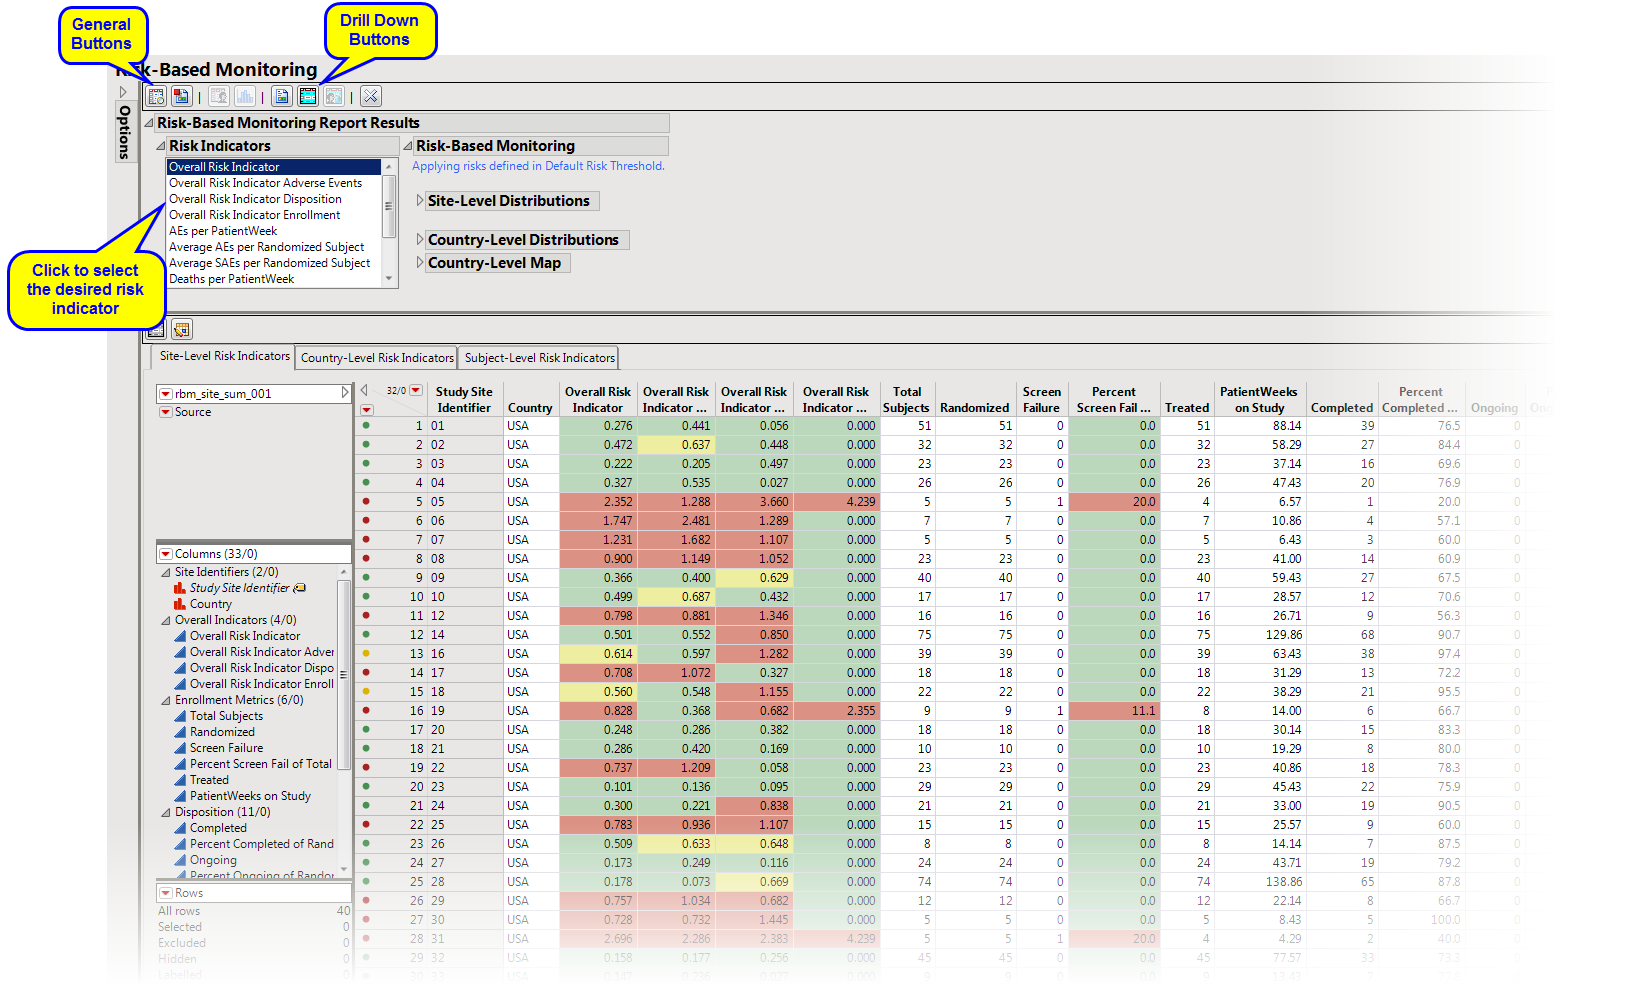
The Report contains the following elements:
|
•
|
Site-Level Distributions: This section contains a series of Histograms for risk indicators from the site-level risk indicators data table.
|
|
•
|
Site-Level Maps: This section contains global and, depending on the countries present in the data, country maps detailing the location of the clinical sites based on geocoding. Site colors are based on the selected risk indicator. Note; This section is present only with geocoded sites.
|
|
•
|
Country-Level Distributions: This section contains a series of Histograms for risk indicators from the country-level risk indicators data table.
|
|
•
|
Country-Level Map: This section contains global map coloring countries based on the selected risk indicator.
|
Click to highlight risk-indicator colors on data table row markers, histogram outliers, and map points. Note: This option is for use with indicators having defined thresholds,
Note: Cells with missing values do not display
|
•
|
Site-Level Data: This data table displays risk indicators derived using the study database as well data included in the supplemental data set. Updated disk indicators can be supplies either by using the Update Study Risk Data Set option or supplemental data sets (See How Supplemental Data Sets are Used by JMP Clinical. for more information.). Risk indicators with defined thresholds are colored in green, yellow, or red. Note: The Signal column is the Risk Score for that particular Risk Indicator.
|
|
•
|
Country-Level Data: This data table displays risk indicators summarized at the country level. Risk indicators with defined thresholds are colored in green, yellow, or red. Note: The Signal column is the Risk Score for that particular Risk Indicator.
|
|
•
|
Subject Summary Data: This data table summarizes the status of the study subjects.
|
|
•
|
Show Subjects: Select subjects and click
|
|
•
|
Report Actions: Click
|
|
•
|
Open Edit Checks: Click
|
|
•
|
Select Rows Using Risk Indicators: Click
|
|
•
|
Select Sites Using Subgroup Selection: Click
|
|
•
|
Click
|
|
•
|
Click
|
|
•
|
Click
|
|
•
|
Click
|
|
•
|
Click the arrow to reopen the completed report dialog used to generate this output.
|
|
•
|
Click the gray border to the left of the Options tab to open a dynamic report navigator that lists all of the reports in the review. Refer to Report Navigator for more information.
|
|
•
|
Click the gray border to the left of the Options tab to open a dynamic report navigator that lists all of the reports in the review. Refer to Report Navigator for more information.
|
|
•
|
|
•
|
where  is the mean, median or user-supplied center value, and xij is the value of the ith site (or country, vendor, monitor) for the jth risk indicator. The quantity cij = |xij - μij|, (xij - μij, or -(xij - mij) for Direction equal to B, U, or L, respectively.
Overall risk indicators are calculated as  , where
  ,
,  , or
, or  for Direction equal to B, U, or L, respectively.The wj are weights for the overall risk indicator; 1 by default.
Refer to How are risk thresholds defined? for more information.