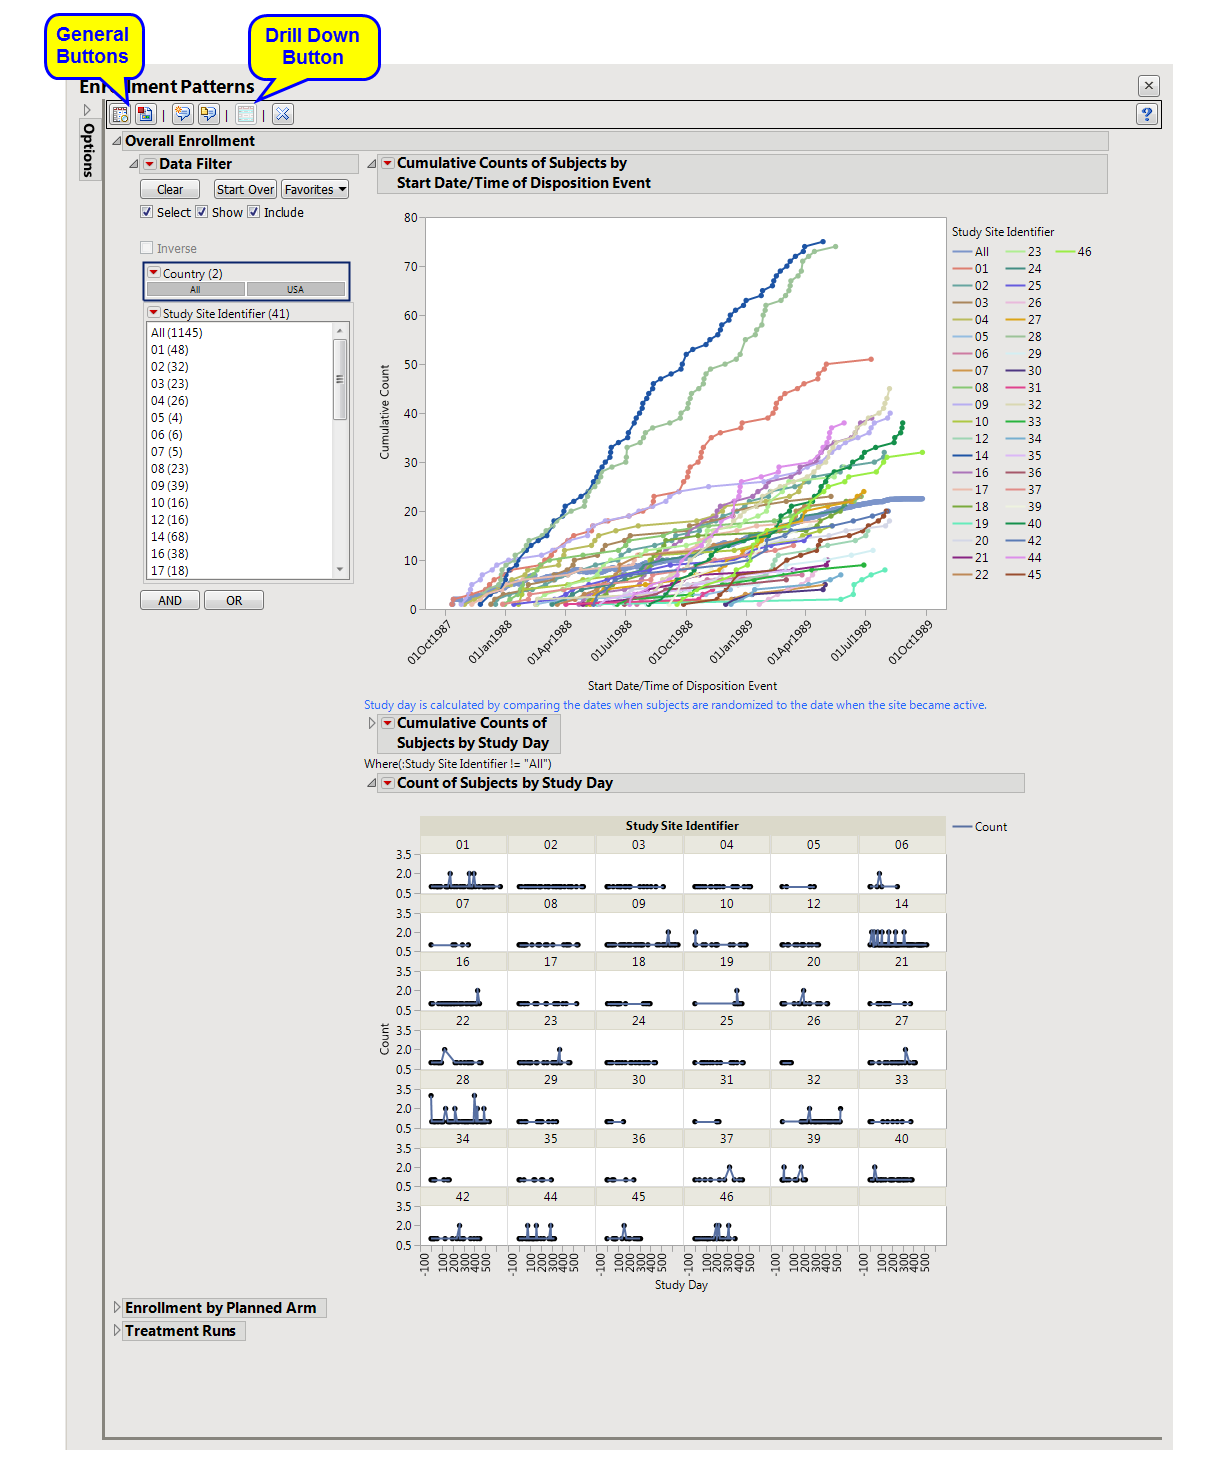
The Enrollment Patterns report plots observed and cumulative enrollment by site. It generates uniformly weighted moving average plots to determine whether enrollment patterns within each site appear unusual.
Running this report with the Nicardipine sample setting and default options generates the output shown below.
|
•
|
Overall Enrollment: Displays two graphs showing the cumulative count of subjects randomized to the trial versus the date as well as study day relative to when the site became active. A plot of counts across study days (relative to site) displays the number of subjects that enroll on any given day.
|
|
•
|
Enrollment by Planned/Actual Arm: Displays plots of the cumulative enrollment across time by either planned or actual treatment arm by study site.
|
|
•
|
Treatment Runs: Displays histograms showing distribution of subjects across study sites, treatment arms, and run counts, which is the number of times a treatment was dispensed in a row within a site. Knowledge of the randomization plan can identify run counts that are not possible in practice.
|
|
•
|
Show Enrollment: Select one or more sites and click
|
|
•
|
Click
|
|
•
|
Click
|
|
•
|
Click
|
|
•
|
Click
|
|
•
|
Click the arrow to reopen the completed dialog used to generate this output.
|
|
•
|
Click the gray border to the left of the Options tab to open a dynamic report navigator that lists all of the reports in the review. Refer to Report Navigator for more information.
|