Running Correlated Findings for Nicardipine using default settings generates the report shown below.
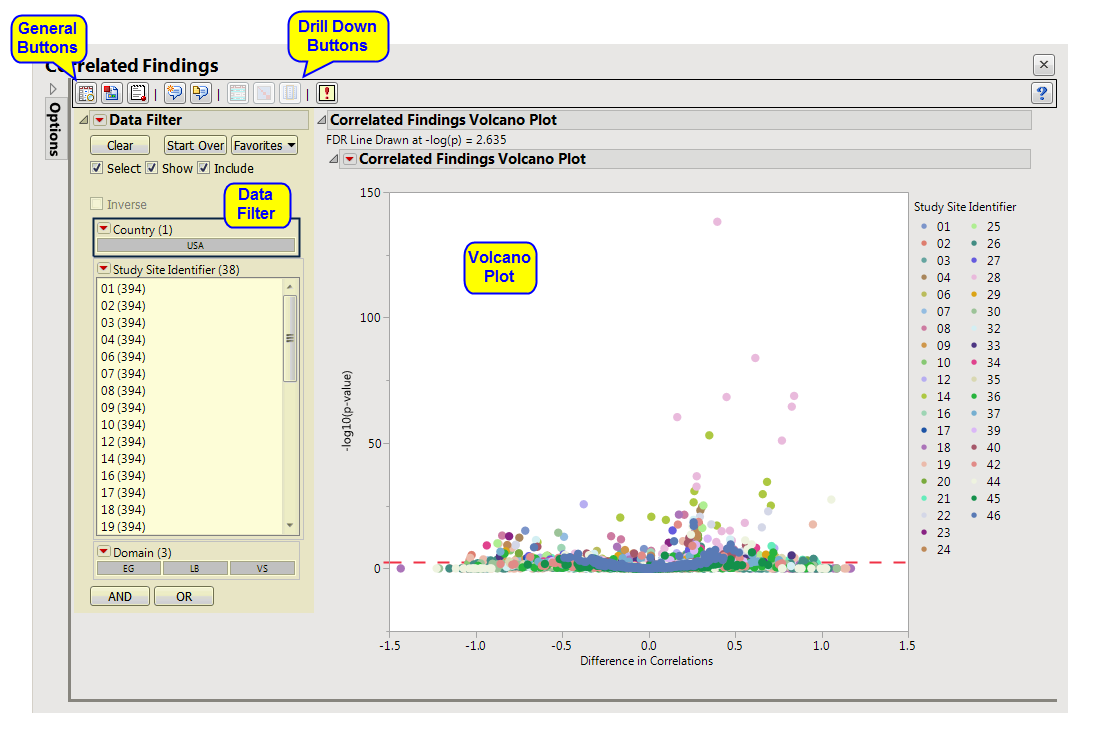
The Report contains the following elements:
|
•
|
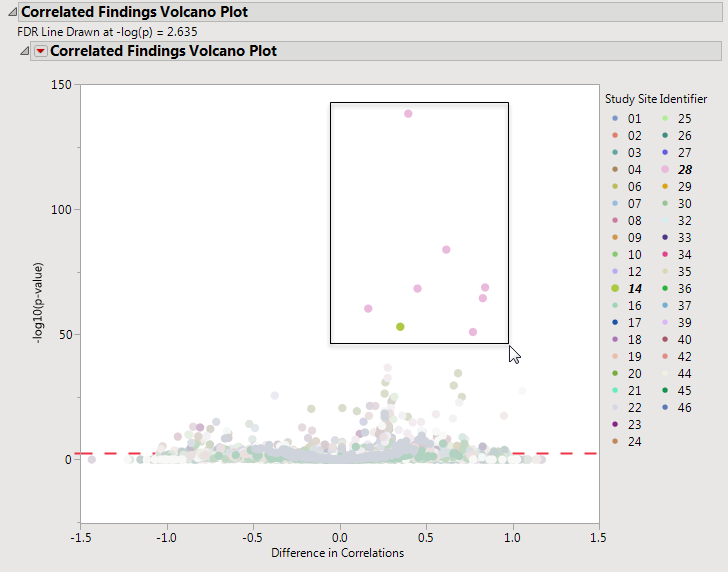
Correlated Findings Volcano Plot: This plot show points representing the correlations between findings. Points close to zero show little or no correlation. Correlations increase the further (either positively or negatively) the further they are from zero. Selected points, in the figure below, are positively correlated.
|
|
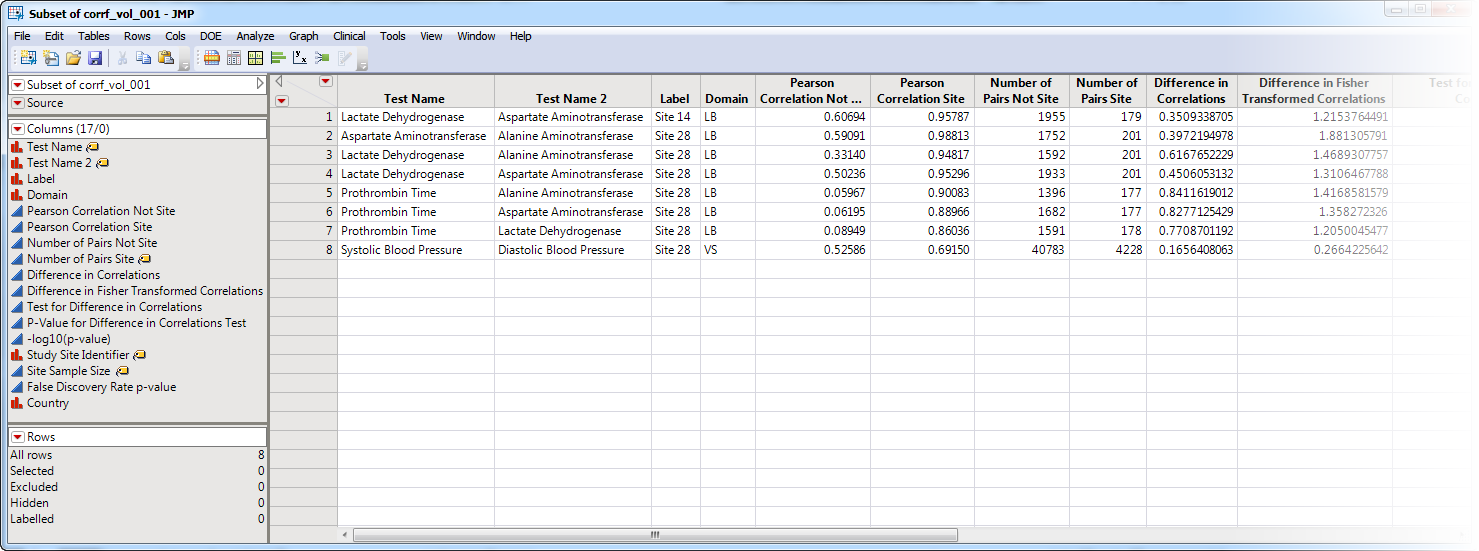
•
|
Show Sites: Shows the rows of the data table for the selected points from the volcano plot. Clicking
|
|
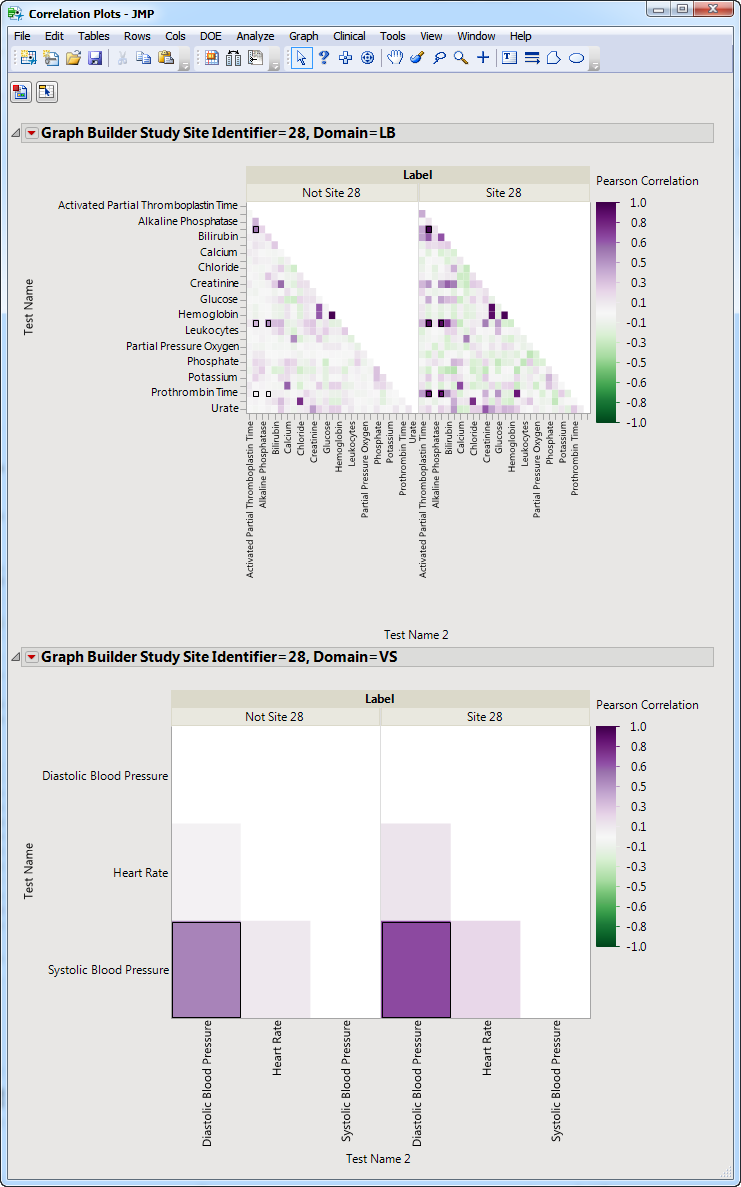
•
|
Show Correlation Plot: Click
|
|
•
|
Show Findings: Click
|
|
•
|
Click
|
|
•
|
Click
|
|
•
|
Click
|
|
•
|
Click
|
|
•
|
Click the arrow to reopen the completed report dialog used to generate this output.
|
|
•
|
Click the gray border to the left of the Options tab to open a dynamic report navigator that lists all of the reports in the review. Refer to Report Navigator for more information.
|
Fisher's transformation (Fisher, 19211, 19702) of the correlation coefficient is calculated for all pairs of tests by CDISC findings domain, with each site (the suspect site, indexed with s) compared to all other sites taken together as a reference (indexed as o). Corresponding p-values are calculated according to a normal approximation.
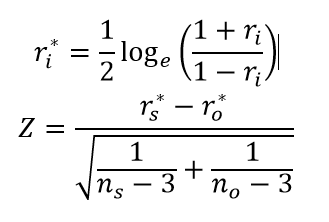
FDR p-values are calculated and the reference line is determined as described in How does JMP Clinical calculate the False Discovery Rate (FDR)?.
Fisher, R.A. (1921). On the "probable error" of a coefficient of correlation deduced from a small sample. Metron 1: 3-32.