This chapter describes the general analysis performed by the JMP Clinical
AE Distribution
,
Events Distribution
,
Interventions Distribution
, and
Findings Distribution
reports. These descriptions apply generally for any event or intervention domain and can be found in the following sections:
Note
: The
Findings Distribution
report has slightly different analyses and results and is covered briefly in a separate section.
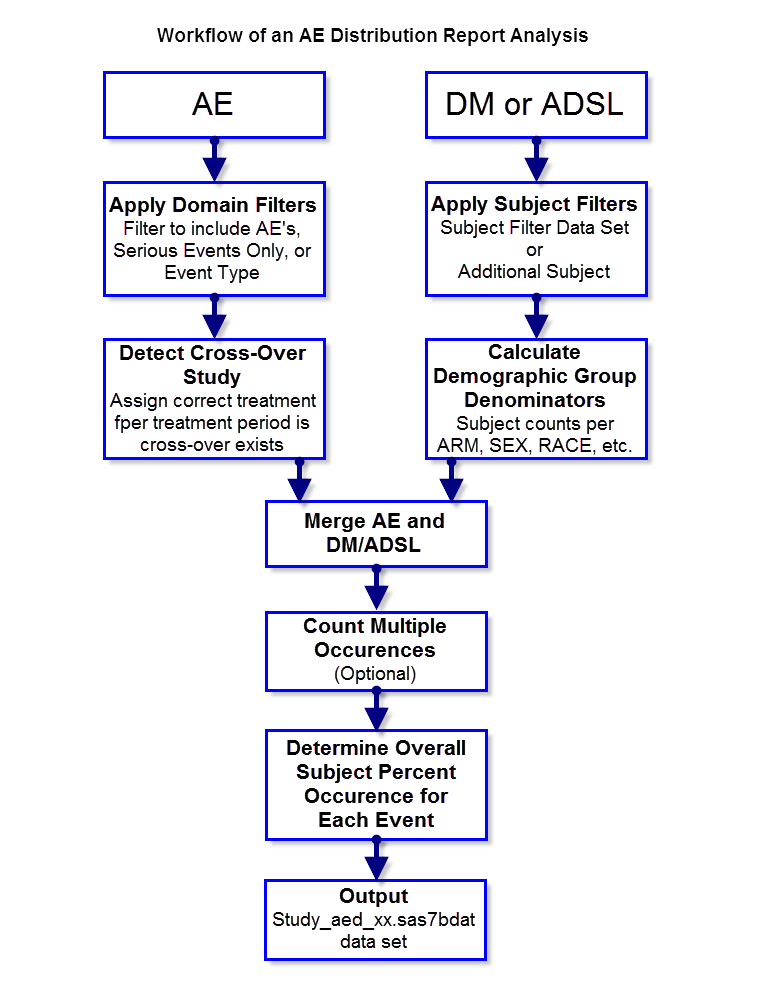
The
AE Distribution
report is used as an example to describe the analysis performed. This report has the most sophisticated
Report Options
of all the
distribution
reports for customizing the resulting reports. Other Events/Interventions domains follow a similar, although simpler,
workflow
.
AE Distribution
requires (or expects) several demographic- and specific domain-related
variables
to generate full report results. The system is flexible. If a certain variable does not exist, the analysis is still performed without it whenever a related variable can be substituted. For example, in
adverse event
, required, or expected, variables include:
|
•
|
USUBJID
,
|
|
•
|
a treatment variable (examples include either
TRTxxP
or
TRTxxA
,
ARM
, or a specified comparison variable
1
),
|
|
•
|
|
•
|
Treatment Date/Time variables (required if filtering interventions/events based on study treatment). These can include
TRTSDTM
,
TRTSDTC
,
TRTEDTM
,
TRTEDTC
(
ADSL
) or
RFXSTDC
,
RFSTDTC
,
RFXENDTC
,
RFENDTC
(DM domain),
EXSTDTC
, and
EXENDTC
(EX domain),
|
|
•
|
|
•
|
AESTDTC
(Required),
|
|
•
|
The
AE Distribution
dialog (shown below) enables you to use the term level and group level that are available in your
ae.sas7bdat
data so that while
AEDECOD
and
AEBODSYS
are specified by default variables in the examples shown here, this specification can be customized based on the term levels available in the given Study.

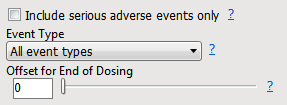
Three parameters,
Include serious adverse events only
,
Event Type
and
Offset for End of Dosing
, are used to specify a domain filter.
|
|||
|
Event Type
options rely on the available
Date/Time
start and end variables referenced above. Options include:
|
|||
|
|||
|
|||
|
|||
You can also use the
Include the following adverse events:
and
Filter to Include Adverse Events
options based on user-customized condition and/or on new/modified/stable records (when JMP Clinical snapshot comparison is being used)
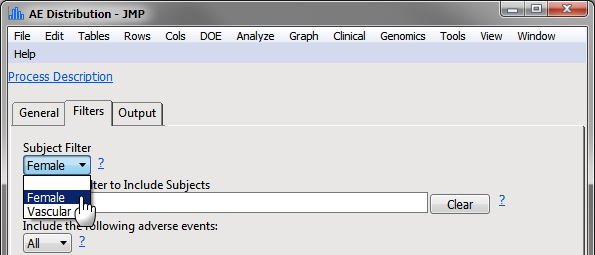
Three parameters,
Subject Filter
,
Additional Filter to Include Subjects
and
Select the population to include in the analysis
, are used to specify a domain filter.
|
|||
|
|||
If an
ADSL
table is defined and contains multiple treatment periods (
TRTxxP
for example) and treatment period start/stop dates,
ADSL
is merged in and the corresponding treatment and period is assigned based on comparison with
AESDTC
.
Note
: If you want to output static AE percent tables only, the
Create Static Report
(
 ) action button should be used.
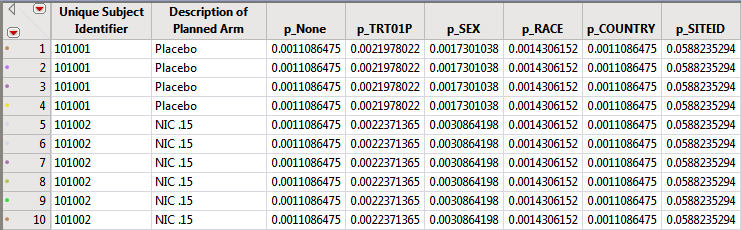
The subject counts for each value of relevant demographic variables (
Treatment
,
SEX
,
RACE
,
COUNTRY
,
SITEID
,
STUDYID
(if not constant) are computed and then the reciprocal of the subject count is recorded in the DM or ADSL data set for merging into AE. This value can be used as a frequency weight for each subject that has a specific event to calculate the percent of subjects for that given demographic group that experience the AE.
Note
: If cross-over is detected, these demographic counts represent the total subjects for EACH treatment period.
The (filtered)
AE
data and the (filtered)
DM
or
ADSL
table (with computed demographic frequencies) are merged by
USUBJID
(and treatment period if cross-over is detected)
This option is turned
OFF
by default.
Percent calculations are performed only if this option is UNCHECKED so that when a unique event is counted only once per subject, you can interpret the frequency of AE counts as the percentage of subjects experiencing the event. The representative adverse event is chosen based on Seriousness (
AESER
if exists), Severity (
AESEV
), and computed study day (
AESTDY
or based on
AESDTC
)
Note
: JMP Clinical assumes accordance with controlled terminology: "Y" to represent severe events, and "MILD", "MODERATE", "SEVERE" to select the serious, most severe event as representative.
For other events/interventions, the representative unique occurrence is chosen based on the first occurrence. The following help documentation for the
Count multiple occurrences of an event per subject
check box
option describes the result of this option.
|
Each subject contributes only
one
time to the occurrence count of an intervention, regardless of how many times that specific intervention might have been applied to the subject.
Note
: Representative intervention occurrence per subject is selected by sorting the data and taking the
first
intervention occurring to a subject based on Study Day.
|
|
|
Compute counts based on the overall counts of interventions, including
multiple
occurrences per subject.
|
After all of these steps have been completed, the
STUDY_ae_xx.sas7bdat
results table is used for the JMP results dashboard report.
|
•
|
Distributions of the event/intervention, descriptive variables about the event/intervention (for example, for AEs this could include
Body System
, Seriousness, Severity, Causality, Outcome, Action Taken, and so on), and demographic distributions of subjects experiencing the event/intervention
|
|
•
|
Column Switchers
: Choose the grouping variable used as the demographic comparison for the counts plot and table and a stacking variable to categorize events/interventions (especially useful with adverse events).
|
|
•
|
: Generates Patient Profiles for subjects experiencing selected events.
|
|
•
|
: Subsets and opens
ADSL
(or
DM
, if ADSL is unavailable) for subjects experiencing selected events. A Table of
USUBJIDs
is also presented.
|
|
•
|
: Clusters subjects experiencing selected events based on available
covariates
.
|
|
•
|
: Creates a data set of
USUBJIDs
for subjects experiencing selected events, which subsets all subsequently run reports to those selected individuals. The currently available filter data set can be applied by selecting the Subject Filter data set in any report dialog on the Filters tab.
|
|
•
|
(AE/Events Distribution only): For subjects experiencing selected events, this action button launches
Interventions Distribution
to summarize the distribution of concomitant medications (
CM
).
|
|
•
|
: For subjects experiencing selected events, this action button generates a stacked Histogram to show subjects across study sites by
Trial Time Windows
.
|
|
•
|
: For subjects experiencing selected events, this action button launches
Findings Time Trends
to summarize laboratory results (
LB
) across time.
|
|
•
|
: For subjects experiencing selected events, this action button launches
Findings Time Trends
to summarize vitals signs (
VS
) across time.
|
|
•
|
: For subjects experiencing selected events, this action button launches
Findings Time Trends
to summarize ECG measurements (
EG
) across time.
|
|
•
|
(Interventions Distribution only): For subjects taking selected medications, this action button launches
AE Distribution
to summarize the distribution of adverse events (
AE
).
|
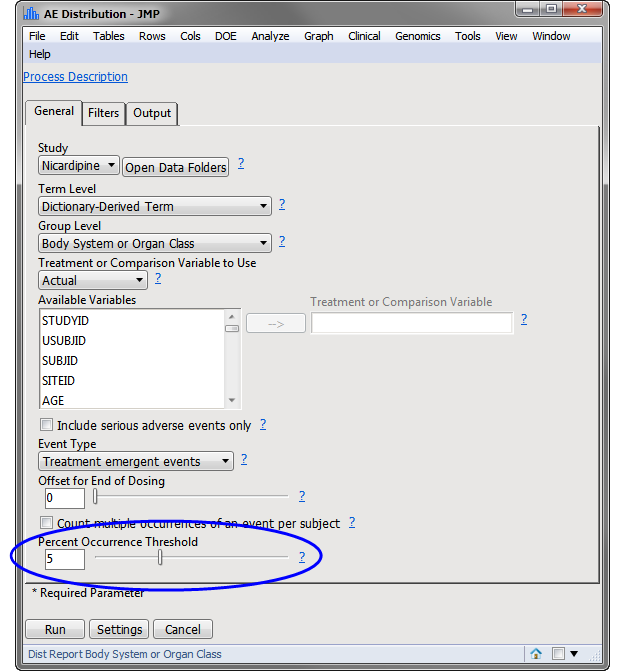
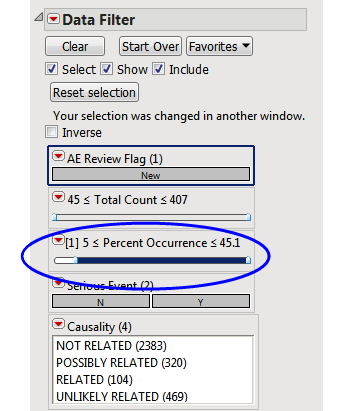
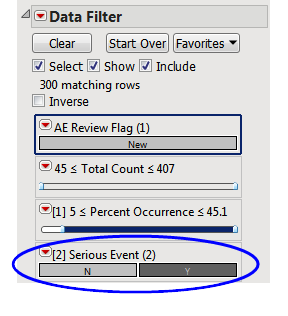
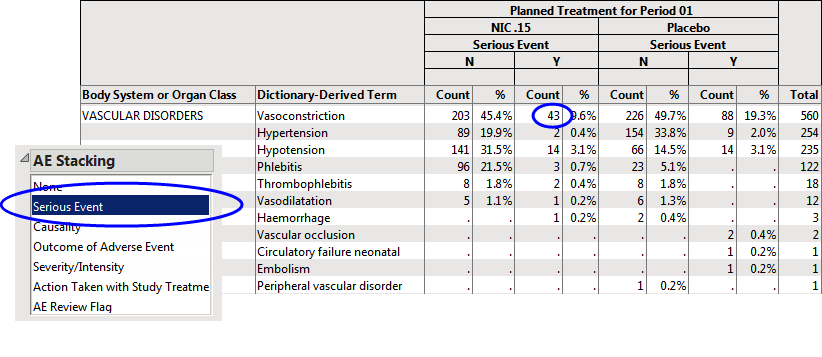
Note
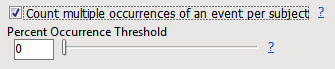
: The most significant change made in this example is that the
Percent Occurrence Threshold
has been adjusted from
0
to
5
(circled above).
|
|
Click
.
|
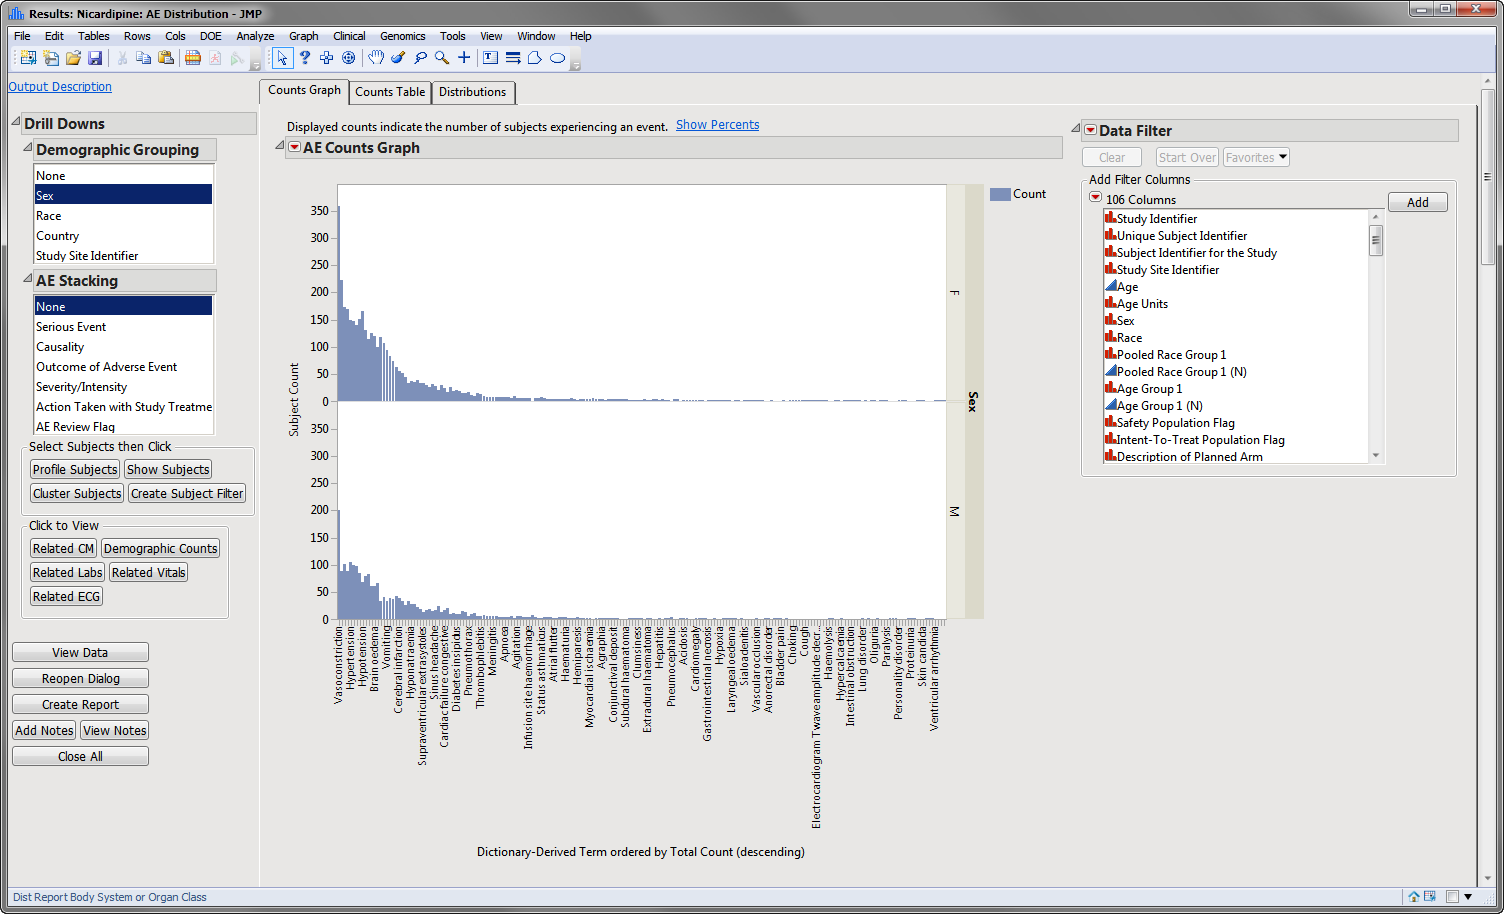
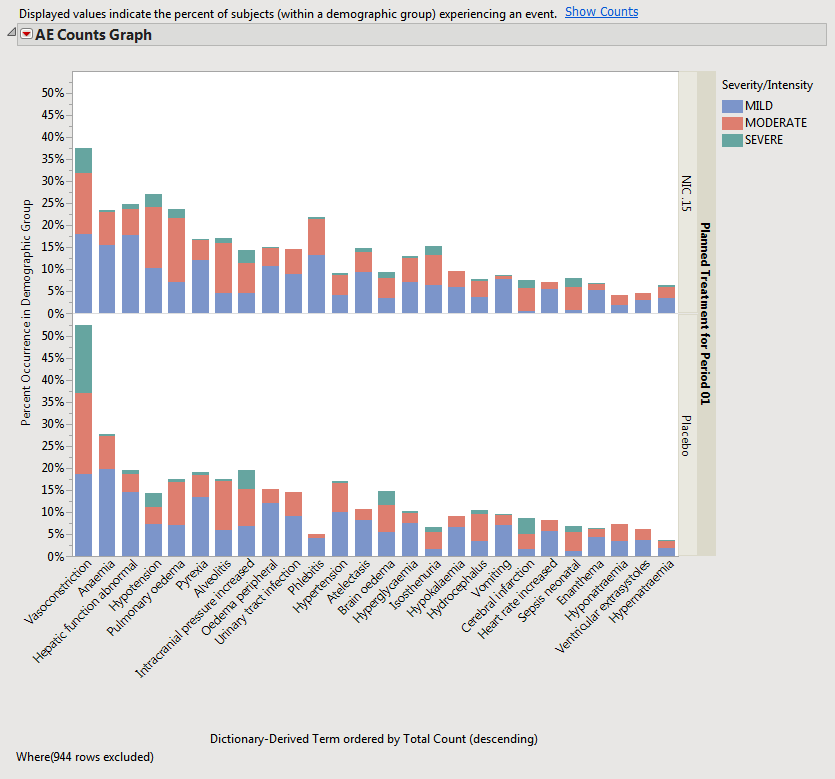
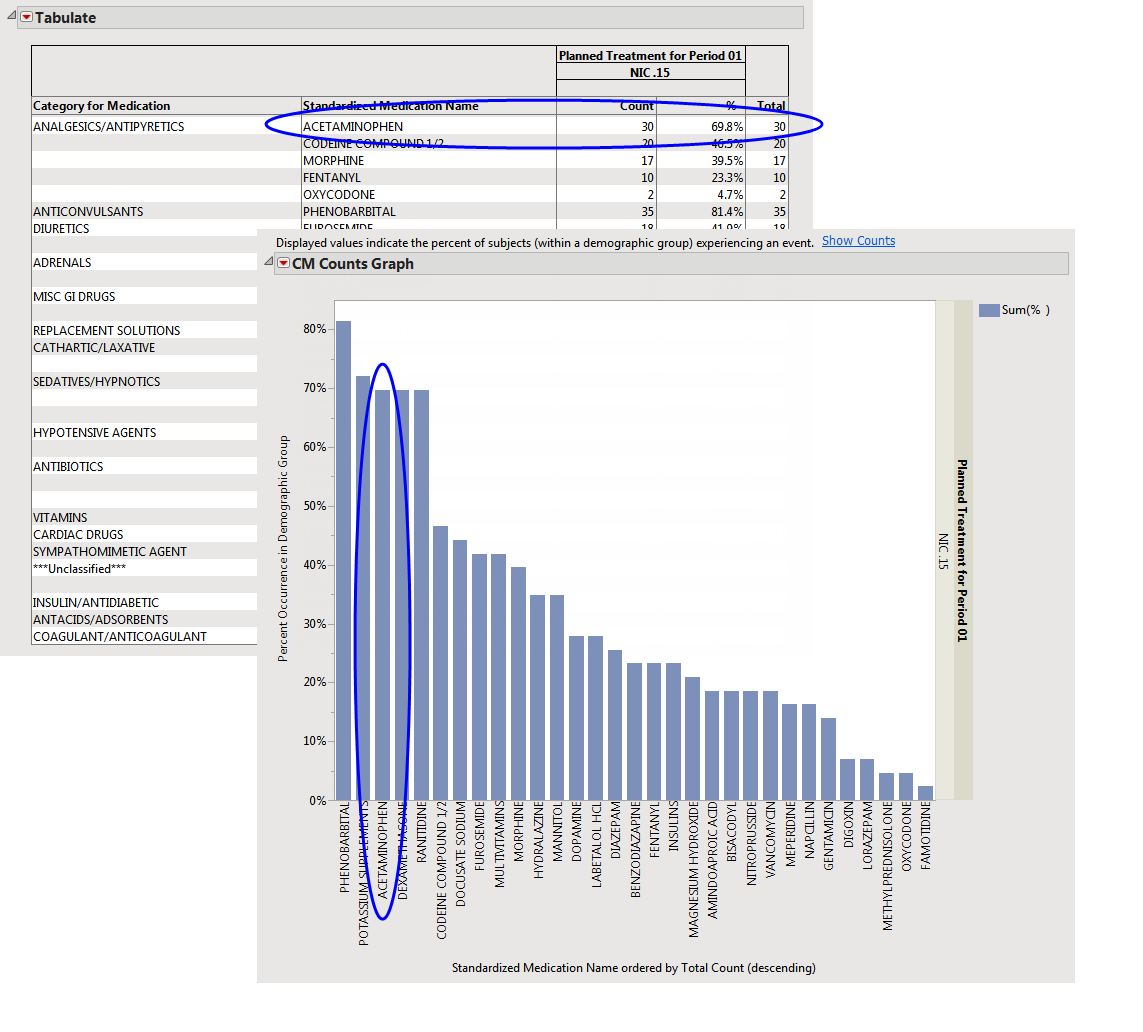
The results of this analysis are based on summarizing adverse events by Dictionary-Derived Term (
AEDECOD
) with group organization as
Body System
or Organ Class (
AEBODSYS
). Variations of options for this are dependent on the available terms in the domain data set.
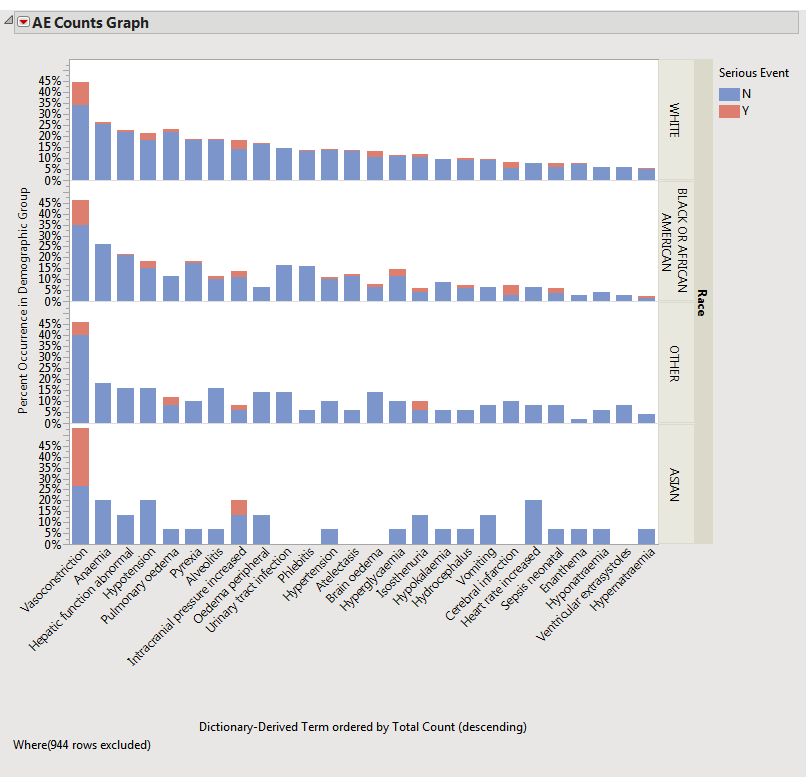
The counts (
Y
axis) represent the count of subjects that experienced the given event term (
X
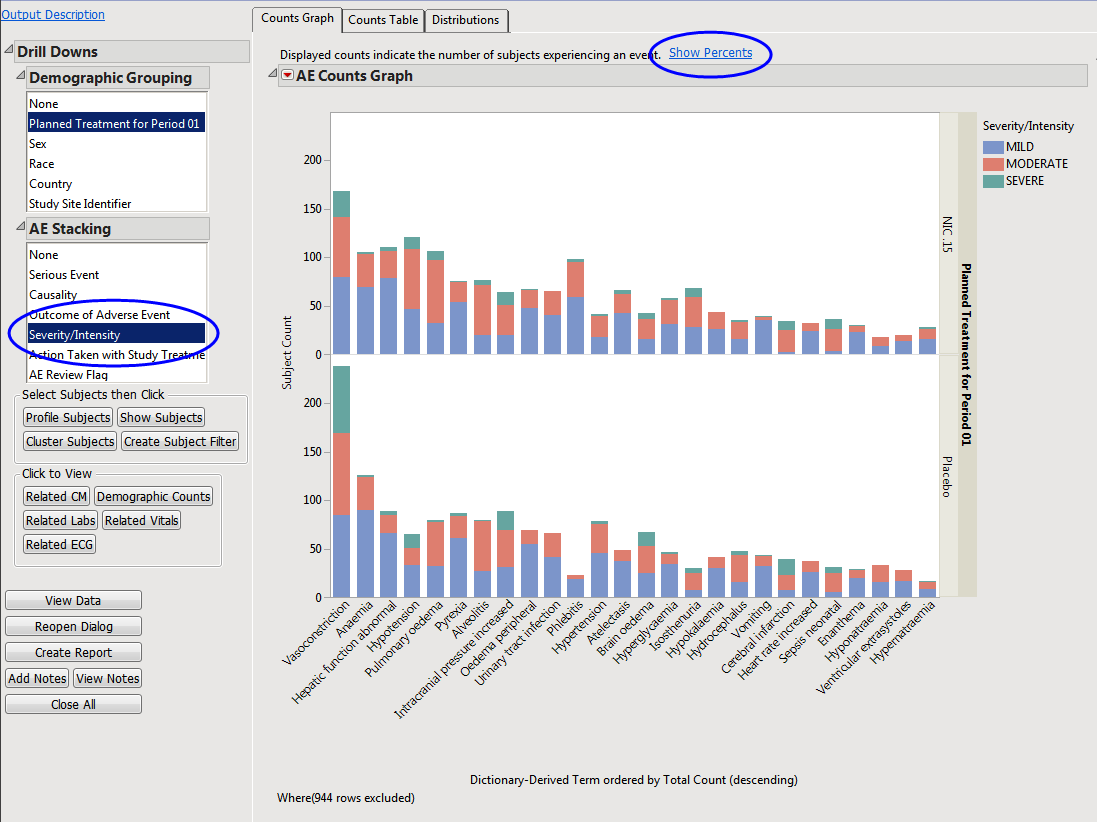
axis); the counts are categorized as stacked
bar charts
for levels of
Severity/Intensity
(
AESEV
). This categorization is a result of choosing that variable from the
AE Stacking
action button.
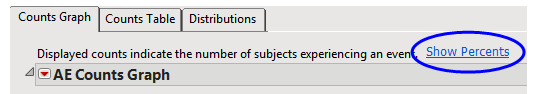
When a unique occurrence is counted only for each subject/event, the percent of subjects experiencing an event within any of the available demographic grouping variables is calculated interactively by the report. The plot below was generated by clicking
Show Percents
(circled above).
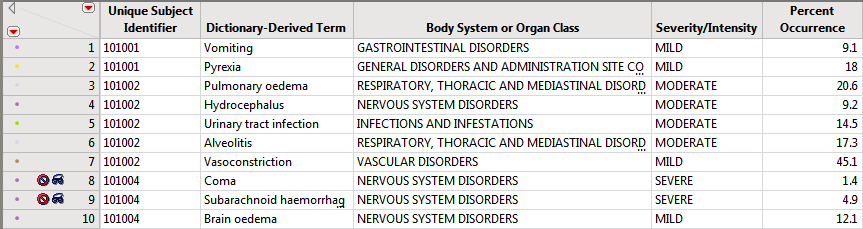
The output
STUDY_aed_xx.sas7bdat
data set used to generate these plots and tables contains a row for each subject experiencing each event (optionally by treatment period in a cross-over scenario).
Rows that do not meet the
Percent Occurrence Threshold
specified on the dialog (5% in this example) are hidden and excluded from analysis. This filter can be interactively changed using the
Data Filter
option for
Percent Occurrence (circled below)
.
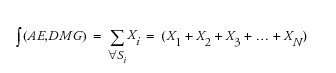
N
= Subject number
Note
:
X
i
=1 if the
i
th subject
Si
is in the DMG (demographic group) and has an AE value on at least one occasion. If these conditions are not met,
X
i
has a value of 0.
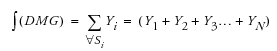
N
= Subject number
Note
:
Y
i
=1 if the
i
th subject
Si
is in the DMG (demographic group). If not,
Y
i
has a value of 0.

Example 1
: Using the action buttons on the Output dashboard, select
None
for
and
None
for
and examine the
Counts Table
tab.
Example 2
: Using the action button on the Output dashboard, select
Planned Treatment for Period 1
for
and
None
for
and examine the
Counts Table
tab. Note how the values change.

Example 3
: Using the action button on the Output dashboard, select
Planned Treatment for Period 1
for
and
Severity/Intensity
for
and examine the
Counts Table
tab. Note how the values change.
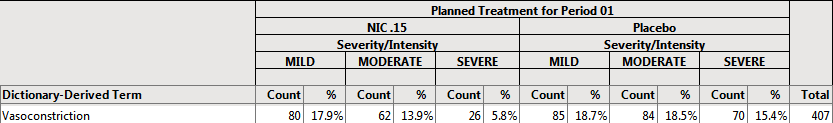
Note
: In the example, the demographic group column changes the percent calculations (also known as changes the value of the denominator used in the formula), while the stacking/categorization variable just partitions the counts and percentages.
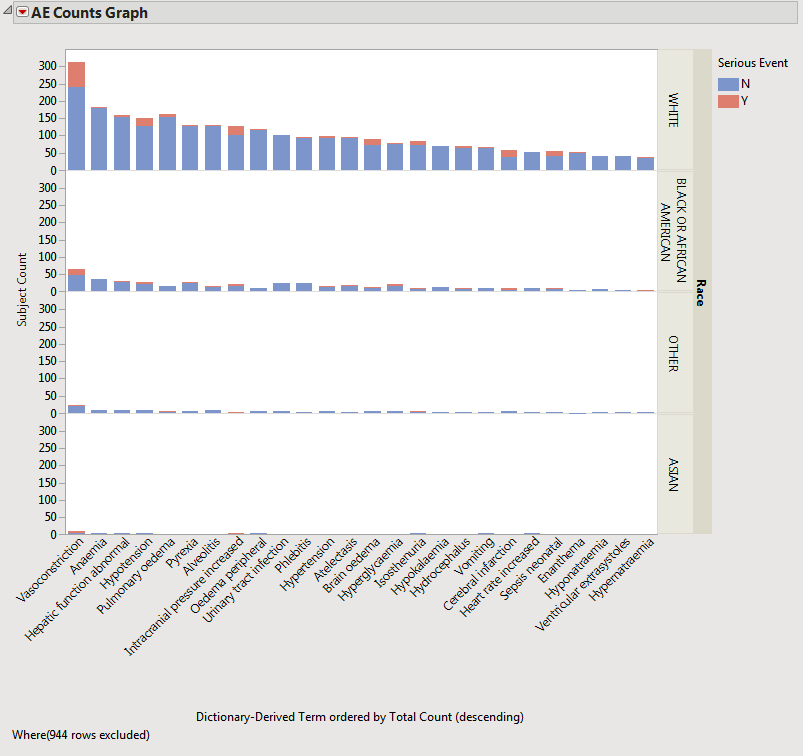
The value of percent calculation comparison can be seen clearly in the two plots shown below. The first plot shows the AE Counts graph grouped by
RACE
and categorized by
Serious Event
.
|
|
Click
Show Percents
(located above the plot and circled below).
|
When you use the
(located on the right side of the report) to filter the records that are shown, the change does NOT affect the demographic group denominator values that are used in the percent calculations. These denominators, as described previously, are derived in the SAS programming of the analysis based on the analysis population. The counts (the numerator in the percent formula) of subjects experiencing the event (and now meeting the data filter criteria) change values to reflect the use of the data filter.
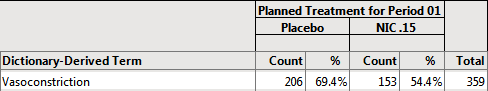
In the following example, the default (Event Type = All)
AE Distribution
report was run for the Nicardipine sample data and the results were subsequently filtered for Serious Event =
Y
, as shown below:
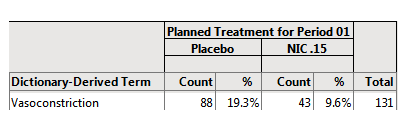
88/455 = 19.3% of subjects on Placebo experienced
serious
vasoconstriction.
In the following example, Sex =
F
has been selected in the data filter:
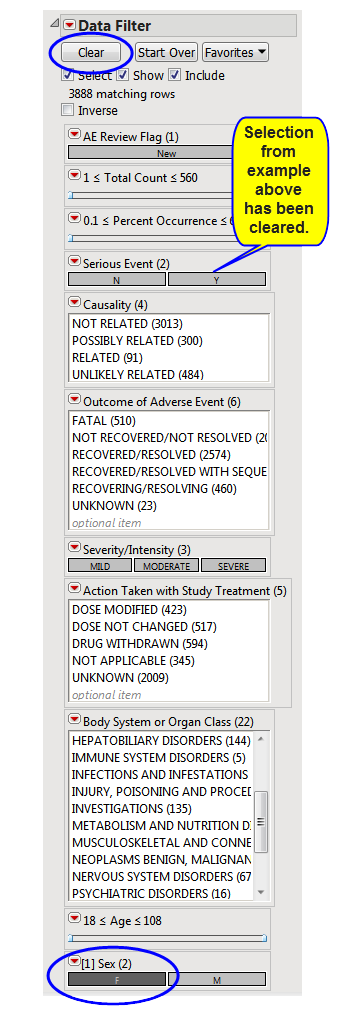
Note
: You must click
(circled above) to clear out prior filters before making a new selection.
Note
: If you want to have such demographic filters reflected in the reference population, a pre-specified filter should be used up front, as described below.
For example, on the
AE Distribution
dialog, you can:
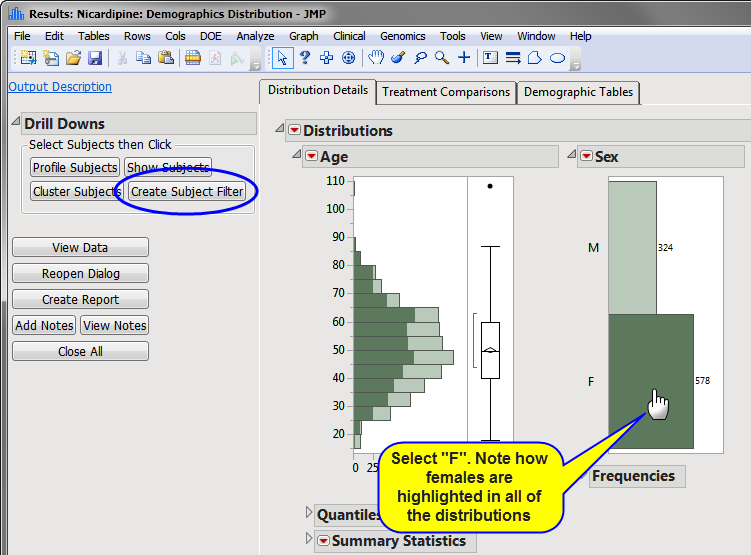
Example 1
: Generate a
Subject Filter
of only females:
|
|
Run
DM Distribution
Report.
|
|
|
Select
F
category in SEX distribution bar chart (or from the data filter). Note how the females are highlighted in all of the distributions.
|
|
|
Click the
action button (circled above).
|
|
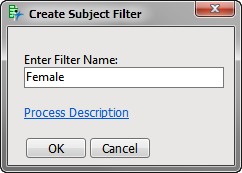
|
Specify this filter as a
Subject Filter
in the AE Distribution dialog
|
|
|
Click
.
|
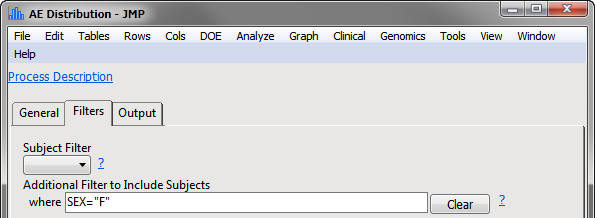
When filtering is applied
up front
, the percent values and their interpretation are based on females only:
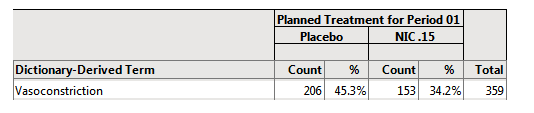
In this example, the 297 female subjects on placebo make up the denominator of the percent calculation. The females showing vasoconstriction represent the subject count (or numerator) that had the event (206 female subjects that had vasoconstriction). In this case, where filtering is applied
BEFORE
the analysis, the percent calculation (206/297 = 69.4%) represents the number of females showing vasoconstriction out of
FEMALE subjects only
on Placebo.
In the example described above, the 455 subjects (male and female) on placebo make up the denominator of the percent calculation. The females s represent the subject count (or numerator) that had the event subject to any data filter specification (206 female subjects that had vasoconstriction). In this case, where filtering is applied
AFTER
the analysis, the percent calculation (206/455 = 45.3%) represents the number of females showing vasoconstriction out of
ALL subjects (not just females)
on Placebo.
The examples described, while highlighting the
AE Distribution
report heavily, also reflect the analyses performed by the other events/interventions distributions.
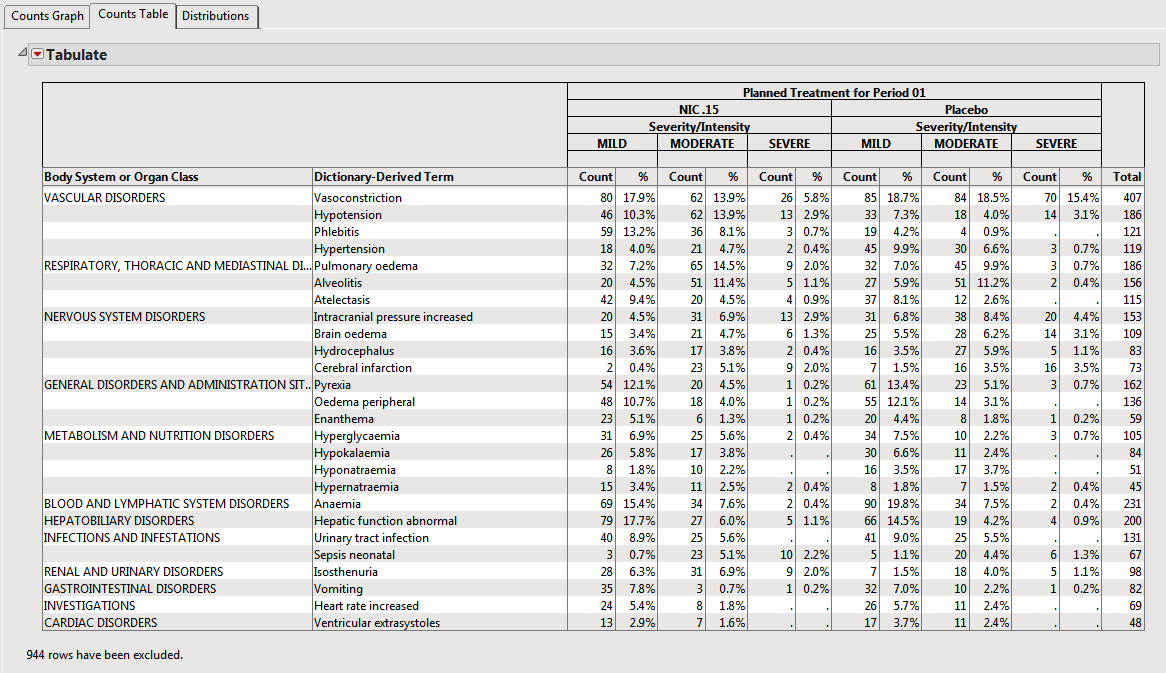
For example, if you run the
AE Distribution
report using the Nicardipine example that is shipped with JMP Clinical and select Serious Event using the
AE Stacking
action button, you see the following
Counts Table
.
|
|
Click
, as shown below.
|

JMP Clinical runs the concomitant medications
Interventions Distribution
report for the 43 selected subjects.
If you click
Show Percentages
on the dashboard, you see the Counts Graph and Counts Table shown below:
The percent calculations are performed only when a unique event/intervention is counted for each subject in the analysis. If you check the
Count multiple occurrences of an event per subject
(or
Count multiple occurrences of an intervention per subject
when running the
Interventions Distribution
), all records are counted in the results report.
With this option specified, percent values are not computed and the
Percent Occurrence Threshold
is ignored since the counts of events no longer represent counts of subjects.
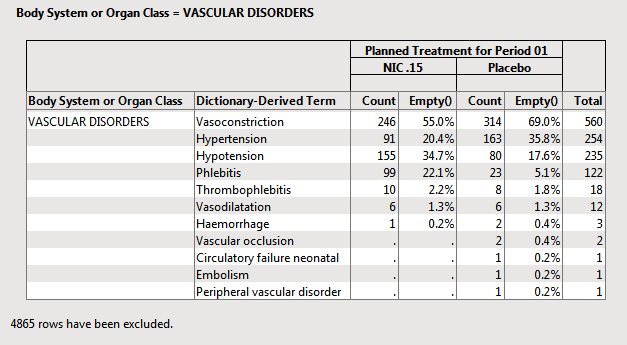
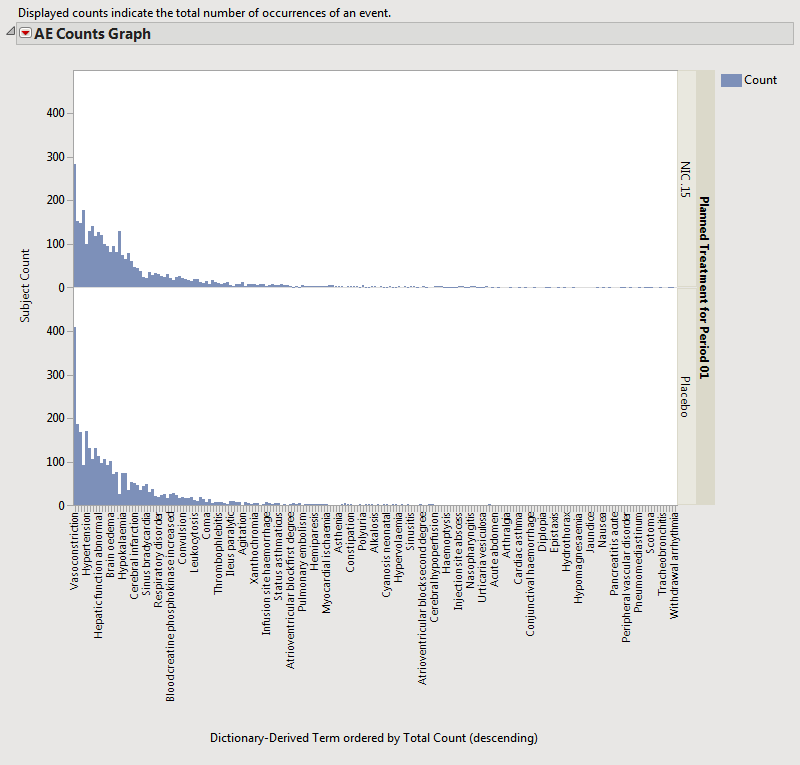
Results for the Nicardipine example study when
AE Distribution
was run for multiple occurrences of events are shown below.
Note
: It might be useful to customize the results report data filter to include the computed
Total Count
column if you want to filter to more commonly occurring adverse events. The grouping and stacking capabilities and action buttons are still available with this view of the report.
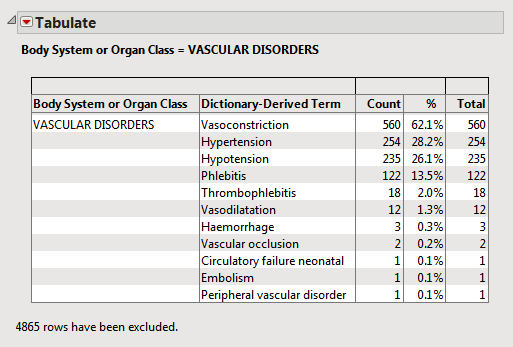
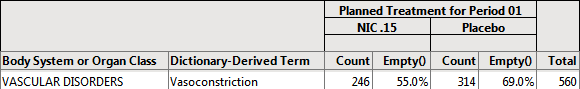
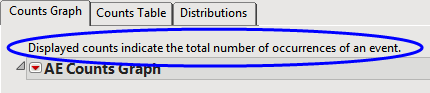
The counts now might represent multiple occurrences of the same event for the same subject. For example, when a unique occurrence only was counted (for all
Event Type
s) in Nicardipine, there was a total of 560 subjects experiencing Vasoconstriction.
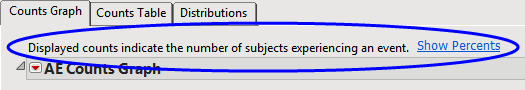
The distinction in the interpretation of the counts is reflected in the text field above the plots on the
Counts Graph
tab.
All distributions (
AE Distribution
,
Events Distribution
,
Interventions Distribution
, and
Findings Distribution
) also include a set of distributions of relevant results variables in the report.
For the
Findings Distribution
report, these distributions are the initial view. The findings calculations follow the same workflow as described by the events computation, but are simpler because no percent calculations are performed. Most of the analyses are derived using the JMP reports.
The
Findings Distribution
report might contain the following results:
|
•
|
Distributions
: Contains distributions of parameters from the specified Findings domain.
|
|
•
|
Count Plots
: Contains graphs for each test to display measurement counts within categories of the
Reference Range Indicator
variable. This tab is displayed only if the
xxNRIND
variable is present in the Findings domain data (typically the
LB
domain).
|
|
•
|
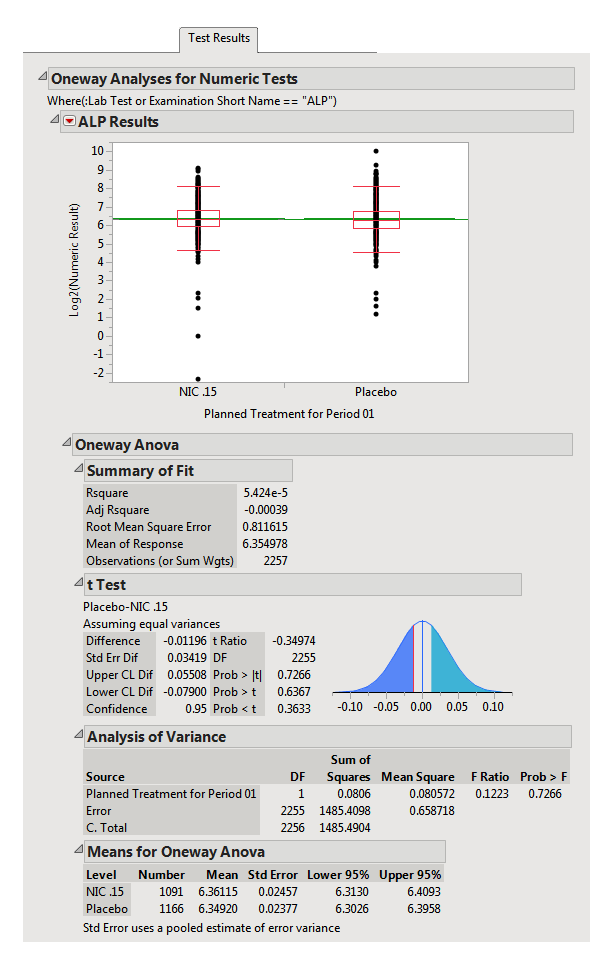
Test Results
: Contains One-way Analyses (
ANOVA
) for each test that has numeric measurement results (
xxSTRESN
values), Contingency Analyses for each Findings test that has character results (
xxSTRESC
values but missing
xxSTRESN
values), or both.
|
|
•
|
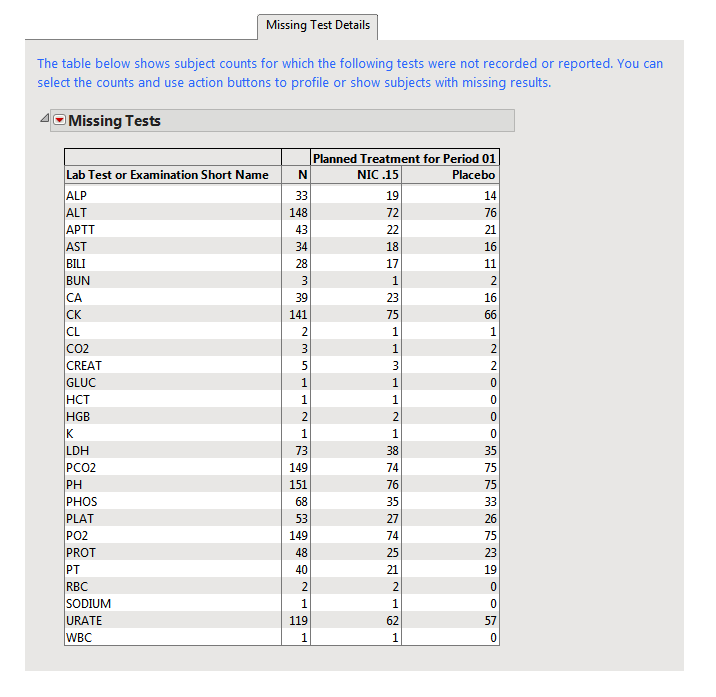
Missing Test Details
: Contains tables displaying subject counts for tests that were either not recorded, or that were recorded but have missing measurement values (of
xxSTRESN
and/or
xxSTRESC
). If all subjects had nonmissing recorded test measurements for all tests, this tab is not shown.
|
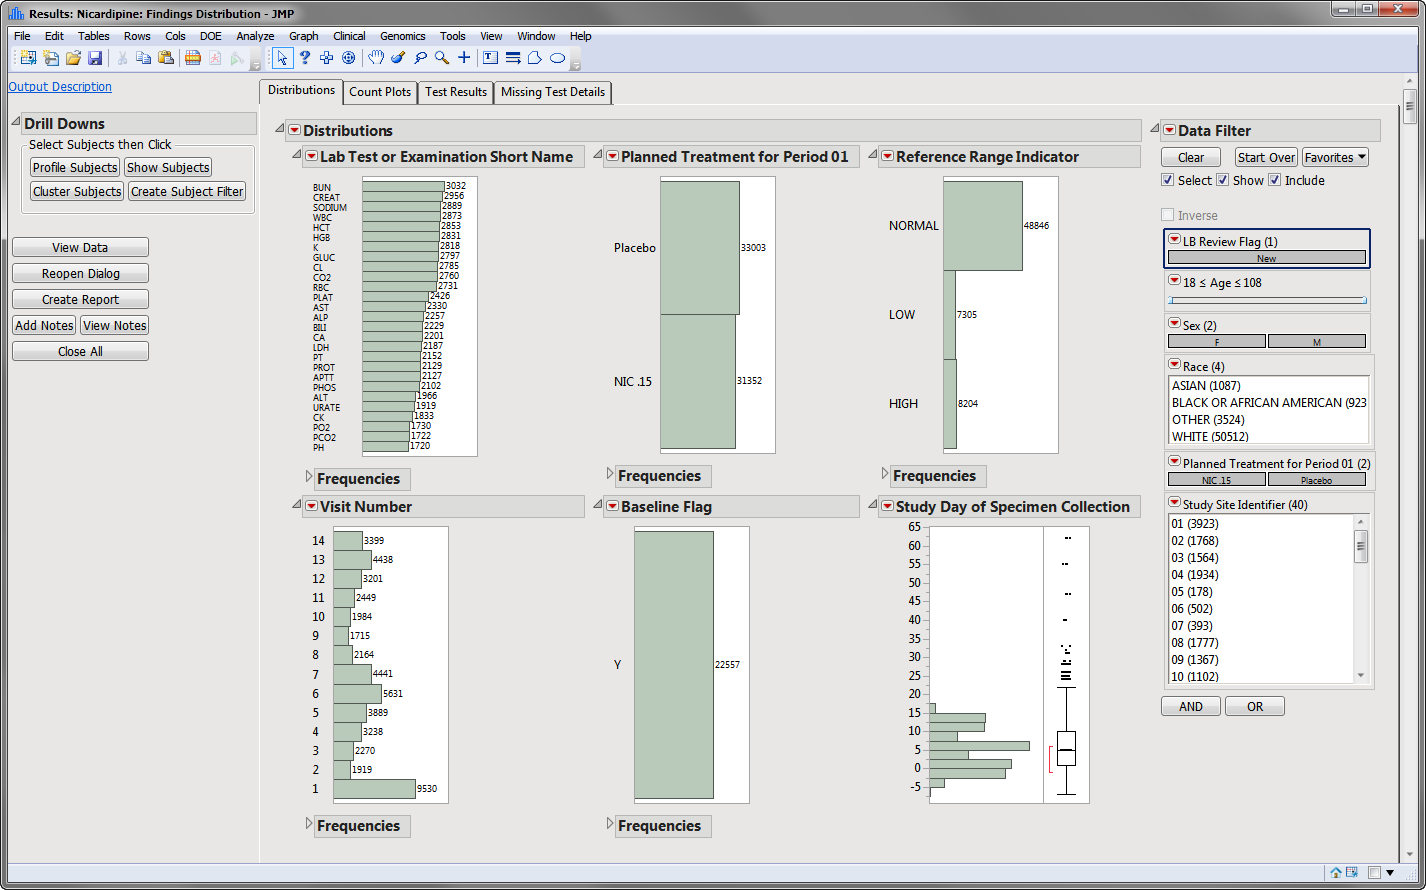
The
Distribution
tab is shown above. The other three tabs are shown below:
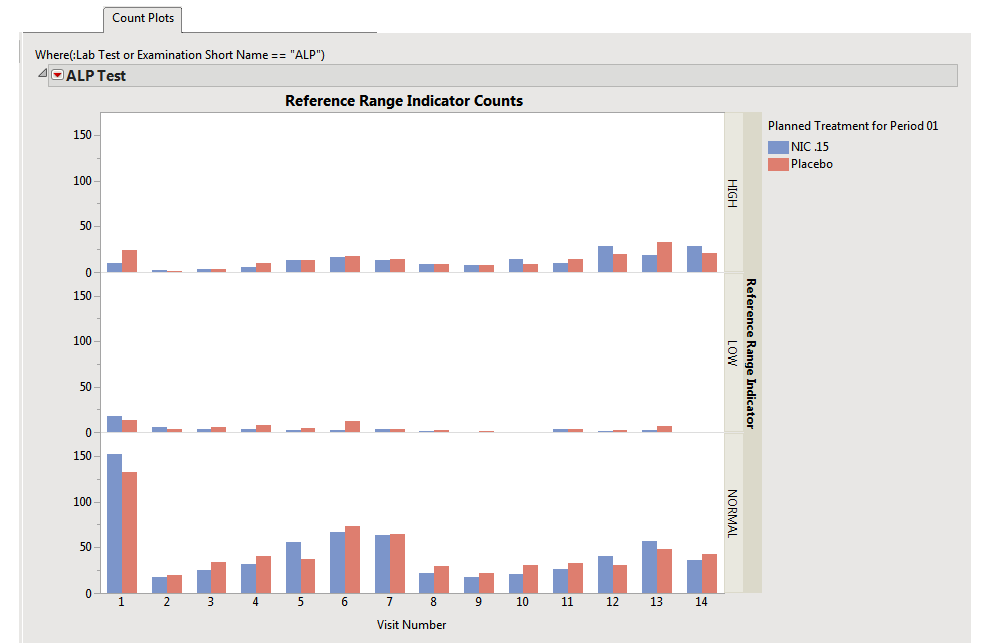
Count Plots:
This plot shows counts of records from the Findings domain by Study Visits. The
xxNRIND
and either the
VISIT
or
VISITNUM
variables are required in the domain in order to produce these plots.
Missing Test Details
; This tab tracks both missing tests and test records that contain
missing values
.
This table displays subject counts for which Findings tests were either not reported or not recorded. For example, the number of subjects for whom no record was taken for the
ALT
lab test in the
LB
domain is displayed in this table for the
ALT
test row.
This table displays subject counts for any Findings test was that was recorded, but has a missing measurement value (missing an
xxSTRESN
value for numeric tests or missing an
xxSTRESC
for categorical tests). This table differs from the Missing Tests Table in that a record was reported for the test for that subject, but the measurement value was missing.
NONE
can also be specified here.