This report compares
distributions
of
adverse events
and demographic
variables
across treatment
arm
.
Note
: Refer to
Distribution Reports
for a description of the general analysis performed by the JMP Clinical distribution reports.
Running AE Distribution with
Nicardipine
using
Actual
for
Treatment or Comparison Variable to Use
generates the
Report
for
AE Distribution
as shown below. Differences with other reports are noted throughout this output description.

|
•
|
: Panel enables analysis of various demographic groups by selected AE.
|
|
•
|
: Panel enables analysis of various AEs by selected demographic group.
|
This enables you to subset subjects based on demographic characteristics and other criteria. Refer to
Data Filter
for more information.
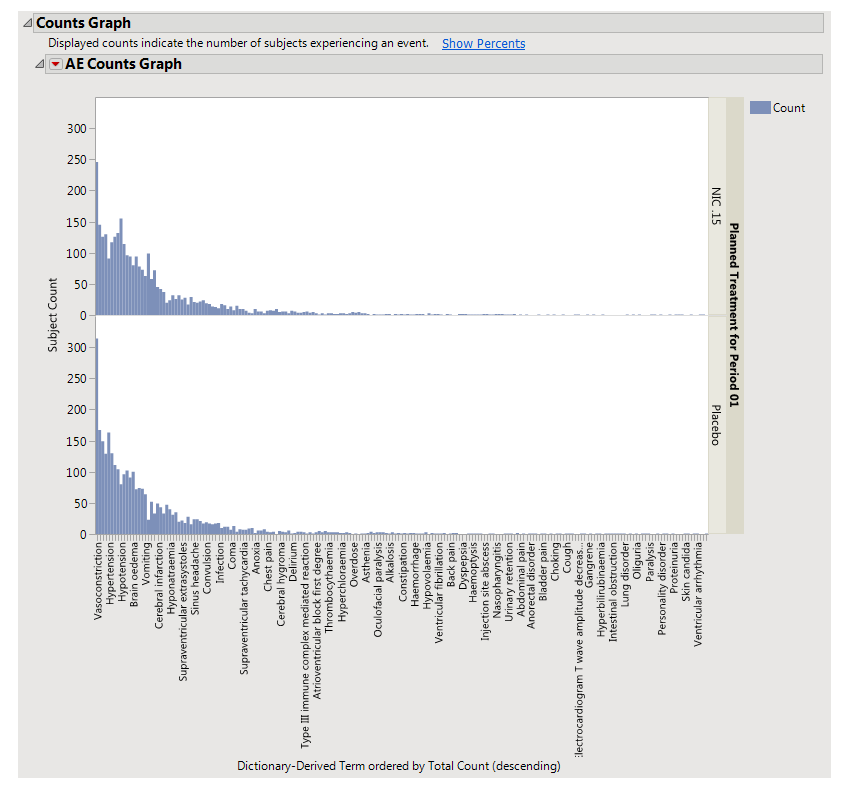
Using a
Bar Chart
or
Tree Map
, this section summarizes the
distributions
of terms based on
xxDECOD
or, if unavailable,
xxTERM
or
xxTRT
depending on
CDISC
domain type. Results are summarized by selected demographic grouping and can be displayed either as total counts or percentages.
If
AEBODSYS
is available, a Table summarizes the distribution of
adverse events,
body system
or
system organ class
. Results are summarized by
Trial Time Windows
. For
Interventions Distribution
,
xxCAT
is used (if available) and the section name reflects the appropriate label. For example, for
CM
, the section is
Category for Medication treemap
.
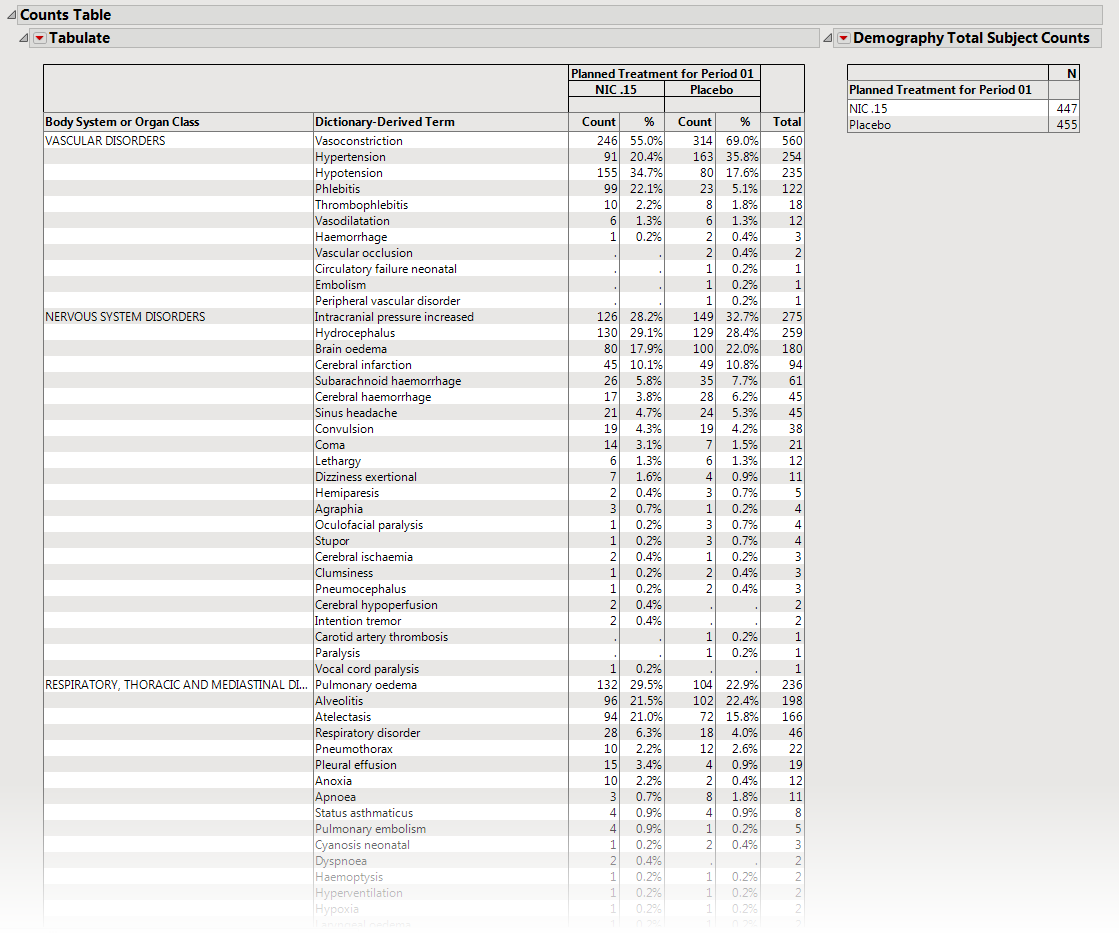
The
Counts Table
section contains the following element:
|
•
|
One
Table
detailing the counts for each treatment group, for each dictionary-derived term within each
body system
or
organ
class.
|
|
•
|
One table listing total demography counts (as taken from
DM
during report generation NOT to be confused with the count of subjects experiencing events) that dynamically changes based on the
Demographic Grouping
column to display the denominators used in Percent calculations, described in
Understanding Count and Percent Calculations
. The values in this table are presented in terms of
N
, the counts of subjects from the demographic table regardless of event occurrence, and used as a reference for indicating how many subjects within a group experienced an event and as the denominators for percent calculations.
|
Presents
Histogram
s
of event characteristics such as
Study Start Day
,
Causality
,
Outcome
,
Severity/Intensity
, and
Seriousness
.
Other Distribution reports
present term, classification, and study day
variables
.

The
Distributions
section contains the following elements:
|
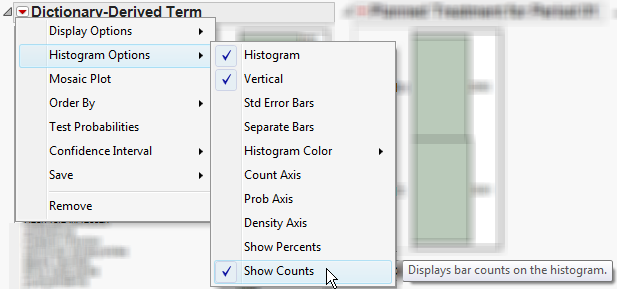
•
|
The height (or length) of each bar is an indication of the number of events exhibiting such characteristics. Numbers above (or to the right of) each bar reflect a count of the number of events. Counts or percents can be added or removed using
Histogram Options
, which can be viewed by selecting the
red triangle
(
 ).
).
Covariates
summarized include
Study Start Day
,
Causality
,
Outcome
,
Severity/Intensity
, and
Seriousness
. If
Count multiple occurrences of an event per subject
is
not
checked, the event chosen is based on sorting the data by seriousness (
AESER
), severity (
AESEV
or
AETOXGR
), and study day (
AESTDY
). For
Events Distribution
or
Interventions Distribution
, the earliest of each event or intervention is presented.
See
Distributions
for more information.
|
•
|
Profile Subjects
: Select subjects and click
|
|
•
|
Show Subjects
: Select subjects and click
|
|
•
|
Cluster Subjects
: Select subjects and click
|
|
•
|
Adverse Events Narrative Generation
: Select subjects and click
|
|
•
|
Demographic Counts
: Select subjects and click
|
|
•
|
Demographic Counts
: Select subjects and click
|
|
•
|
Related CM
(
AE Distribution
only): Select subjects and click
|
|
•
|
Related Labs
: Select subjects and click
|
|
•
|
Related Vitals
: Select subjects and click
|
|
•
|
Related ECG
: Select subjects and click
|
|
•
|
Related AE
(
Interventions Distribution
only): Select subjects taking selected medications and click
|
|
•
|
Unique Occurrence Subject Counts
: Select individual records and click
|
|
•
|
Click
|
|
•
|
Click
|
|
•
|
Click
|
|
•
|
Click
|
|
•
|
Click the
Options
arrow to reopen the completed report dialog used to generate this output.
|
|
•
|
Click the gray border to the left of the
Options
tab to open a dynamic report navigator that lists all of the reports in the review. Refer to
Report Navigator
for more information.
|
Note
: For information about how treatment emergent adverse events (TEAEs) are defined in JMP Clinical, please refer to
How does JMP Clinical determine whether an Event Is a Treatment Emergent Adverse Event?
.
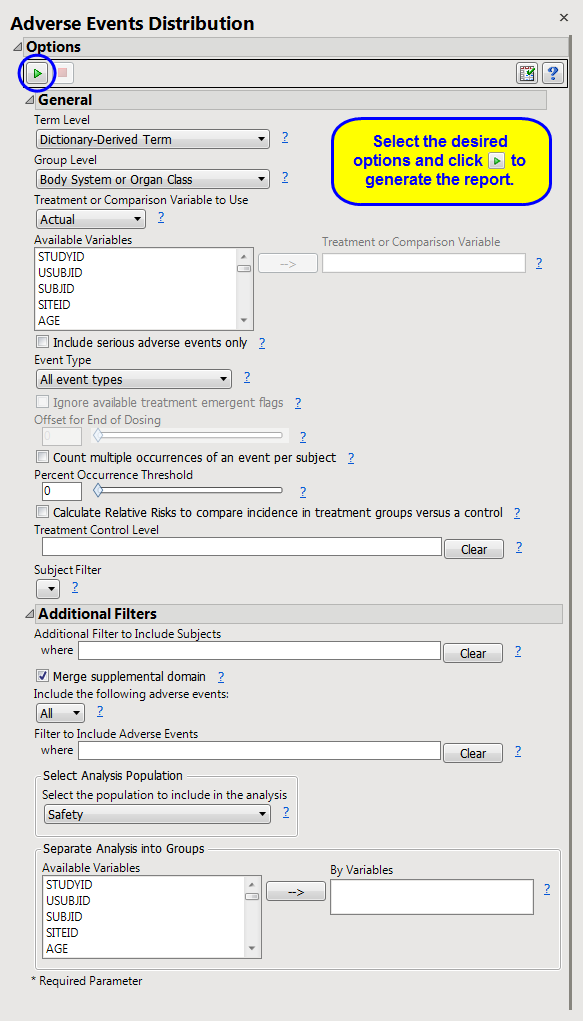
Calculate Relative Risks to compare incidence in treatment groups versus a control
,
Treatment Control Level
Subject-specific filters must be created using the
Create Subject Filter
report prior to your analysis.
For more information about how to specify a filter using this option, see
The SAS WHERE Expression
.