This report screens all
adverse events
by performing a
Cochran-Mantel-Haenszel exact test
on all 2 x 2 tables constructed from event resolution and treatment
arm
. Resolution is computed directly from the end time of an adverse event and the end time of the trial, or from a resolution time that you specify.

Refer to the
AE Incidence Screen
report description, keeping in mind the following important report differences in contrast with the example:
|
•
|
output (including section names) reflects
adverse event
resolution
(resolution status is determined by
Determine Resolved / Not Resolved Status using:
), rather than incidence
|
|
•
|
Time s for Start of AE
replaces
Trial Time Windows
|
|
•
|
Dot Plot
: Click
|
|
•
|
Relative Risk Plot
: Click
|
|
•
|
Odds Ratio Plot
: Click
|
|
•
|
Contingency Analysis
: Click
|
|
•
|
Venn Diagram
: Click
|
|
•
|
Tabulate
: Click
|
|
•
|
Click
|
|
•
|
Click
|
|
•
|
Click
|
|
•
|
Click
|
|
•
|
Click the
arrow to reopen the completed report dialog used to generate this output.
|
|
•
|
Click the gray border to the left of the
Options
tab to open a dynamic report navigator that lists all of the reports in the review. Refer to
Report Navigator
for more information.
|
Note
: For information about how treatment emergent adverse events (TEAEs) are defined in JMP Clinical, please refer to
How does JMP Clinical determine whether an Event Is a Treatment Emergent Adverse Event?
.
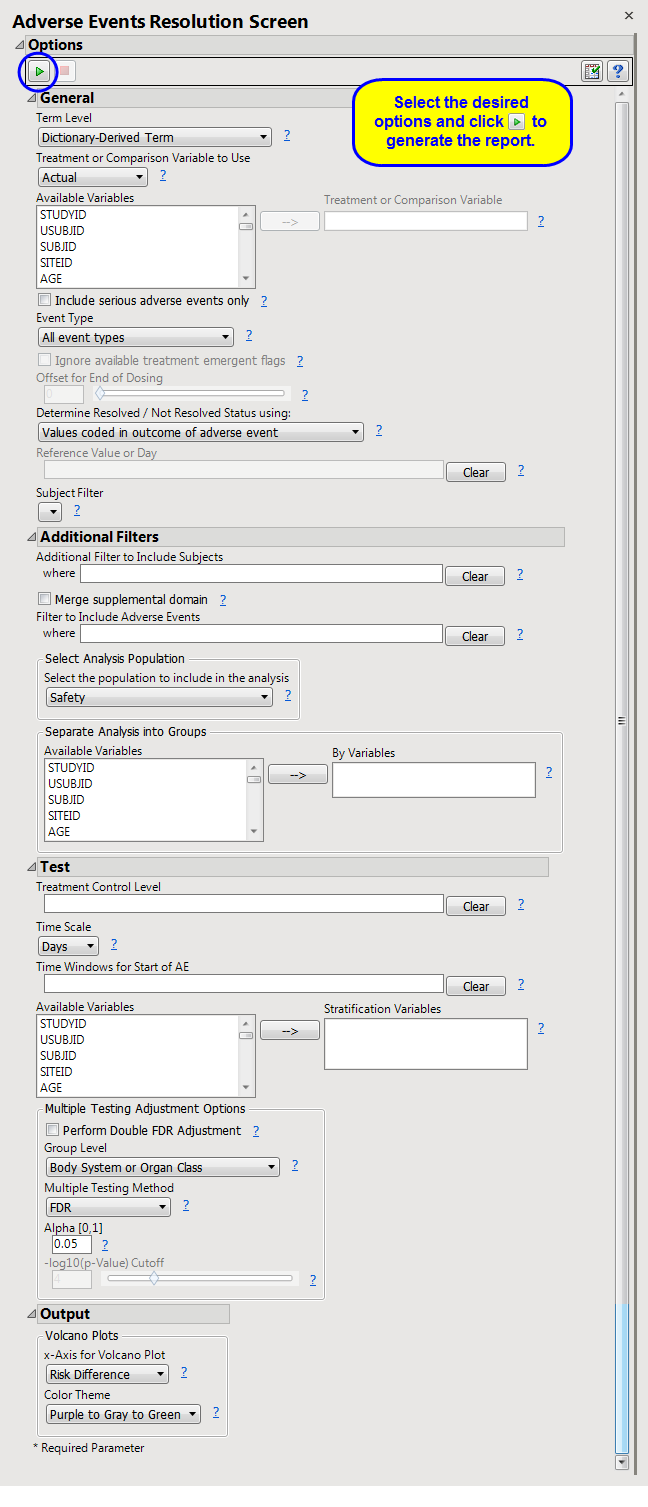
Include serious adverse events only
,
Event Type
,
Ignore available treatment emergent flags
,
Offset for End of Dosing
,
Determine Resolved / Not Resolved Status using:
,
Reference Value or Day
Additional Filter to Include Subjects
2
Merge supplemental domain
,
Filter to Include Adverse Events
,
Select the population to include in the analysis
,
By Variables
Treatment Control Level
,
Time Scale
,
Time s for Start of AE
,
Stratification Variables
,
Perform Double FDR Adjustment
,
Group Level
,
Multiple Testing Method
,
Alpha
,
-l
og
10
(p-Value) Cutoff
Subject-specific filters must be created using the
Create Subject Filter
report prior to your analysis.
For more information about how to specify a filter using this option, see
The SAS WHERE Expression
.