This report fits the multi-level Bayesian hierarchical
models
of Berry and Berry (2004)
1
and Xia, Ma, and Carlin (2011)
2
.
Adverse events
are modeled taking into account a grouping
variable
, such as
system organ class
.
Running this report for
Nicardipine
using default settings generates the tabbed
Results
shown below.

The
Results
displays the following sections:
Results Sections
,
Volcano Plot for Odds Ratio
,
Volcano Plot for Difference in Proportions
,
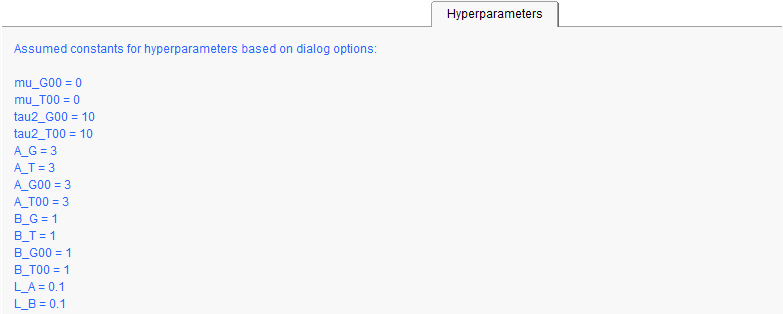
Hyperparameters
, and
MCMC Diagnosis
.
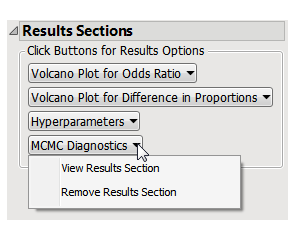
This pane enables you to access and view the output plots and associated data sets on each tab. Use the drop-down menu to view the section in the
Results
pane or remove the section and its contents from the
Results
pane.
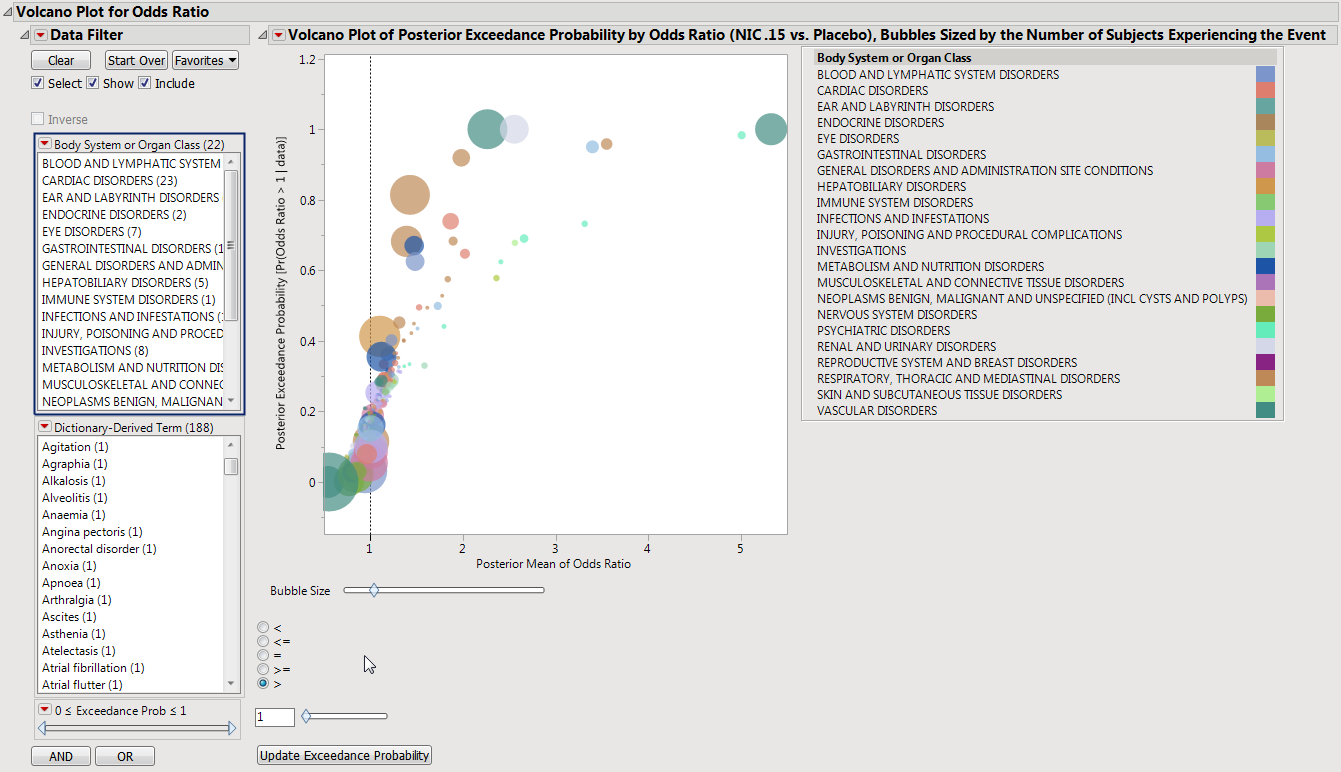
Contains a
volcano plot
of the posterior exceedance probability by odds ratio sized by the number of subjects experiencing each event.
|
•
|
One
Data Filter
.
|
Enables you to subset subjects based on body system or organ class, dictionary-derived term, and/or exceedance.. Refer to
Data Filter
for more information.
|
•
|
One
Volcano Plot
of Posterior Exceedance Probability by Odds Ratio Sized by the Number of Subjects Experiencing the Event
.
|
In this example, markers are colored by
Body System or Organ Class
, and sized by the number of subjects who experience the event.
Adjust the plot using the
Circle Size
slider, inequality sign, and exceedance probability. Click
to update the plot.
Refer to
Volcano Plot
for more information about interpreting these plots.
|
•
|
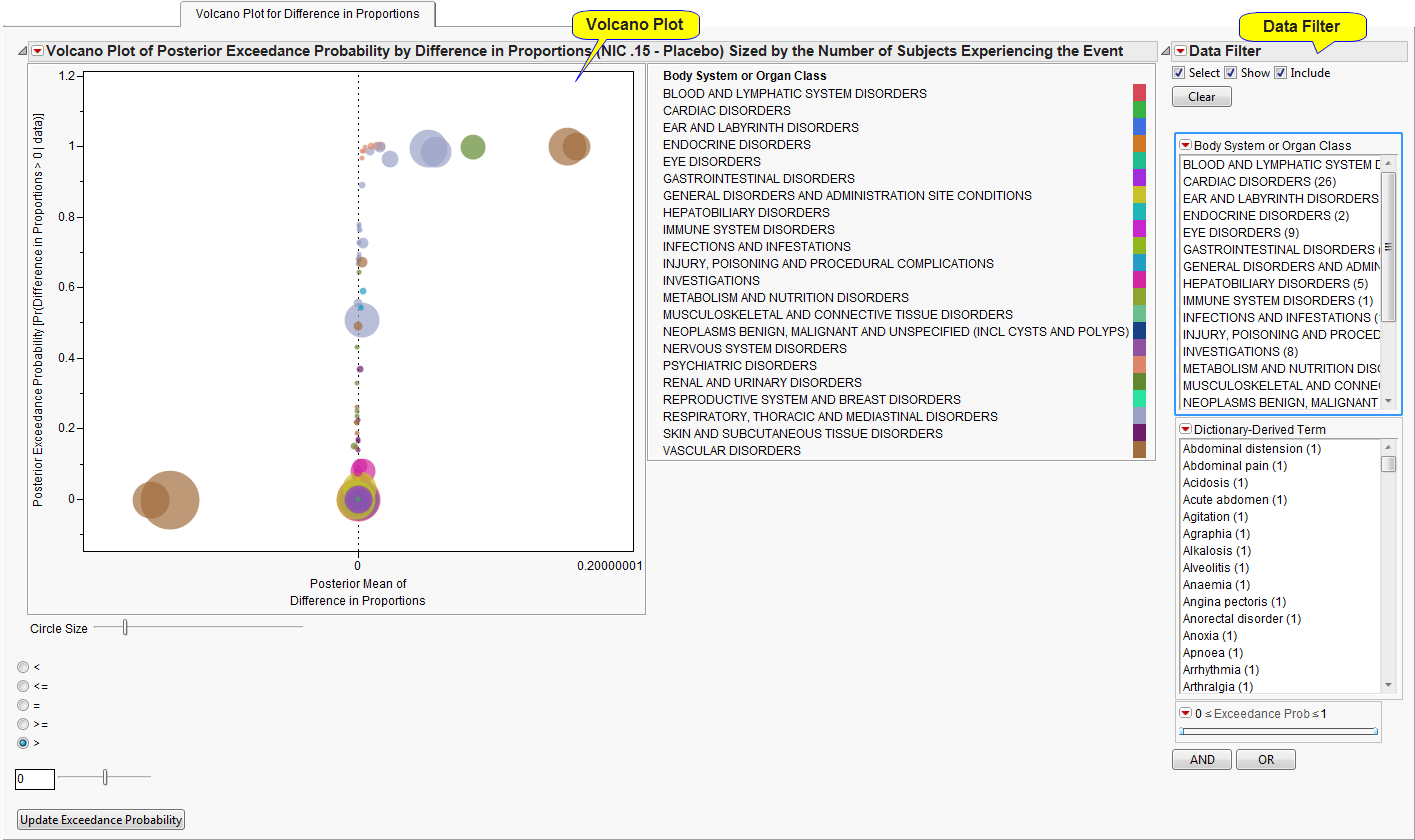
One
Data Filter
.
|
Enables you to subset subjects based on body system or organ class, dictionary-derived term, and/or exceedance.. Refer to
Data Filter
for more information.
|
•
|
One
Volcano Plot
of Posterior Exceedance Probability by Difference in Proportions Sized by the Number of Subjects Experiencing the Event
.
|
In this example, markers are colored by
Body System or Organ Class
, and sized by the number of subjects who experience the event.
Adjust the plot using the
Circle Size
slider, inequality sign, and exceedance probability. Click
to update the plot.
Refer to
Volcano Plot
for more information about interpreting these plots.
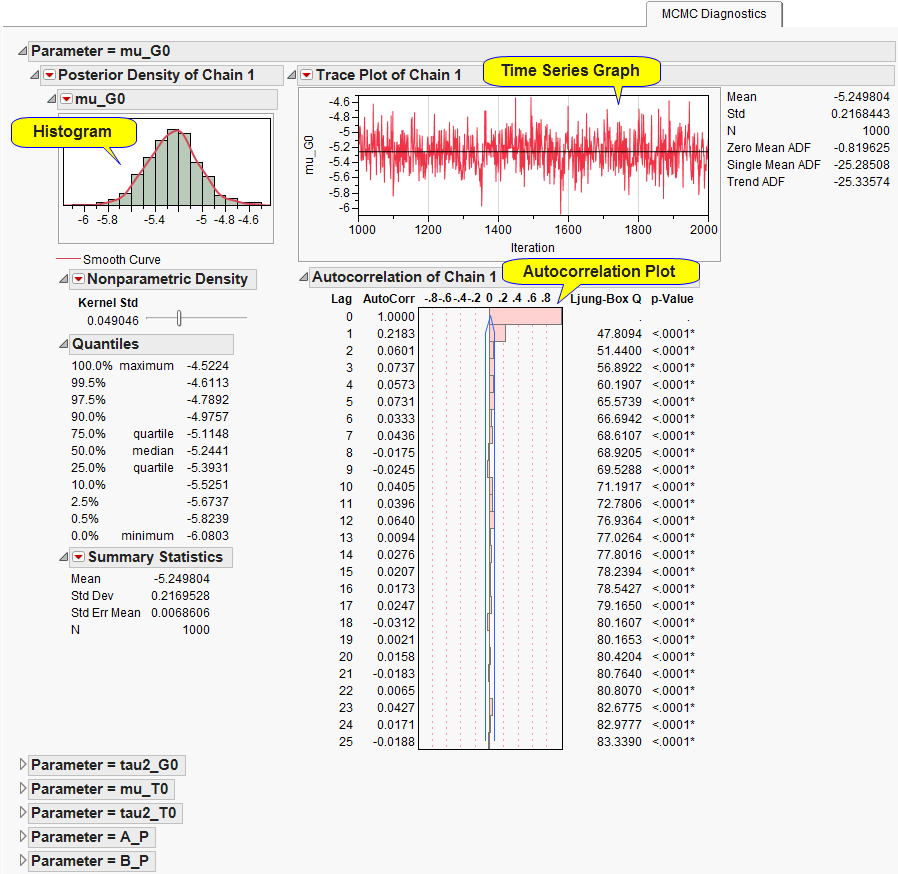
Note
: The
MCMC Diagnostics
section is not shown by default, as it contains a large set of detailed graphs. If you decide to view this section, click on it from the
ResultsSection
pane, select
View Results Section
, and allow a few moments for it to load.
|
•
|
|
•
|
Forest Plots of Credible Intervals
: Select events and click
|
|
•
|
Show Events
: Select events and click
|
|
•
|
Click
|
|
•
|
Click
|
|
•
|
Click
|
|
•
|
Click
|
|
•
|
Click the
arrow to reopen the completed report dialog used to generate this output.
|
|
•
|
Click the gray border to the left of the
Options
tab to open a dynamic report navigator that lists all of the reports in the review. Refer to
Report Navigator
for more information.
|
Note
: For information about how treatment emergent adverse events (TEAEs) are defined in JMP Clinical, please refer to
How does JMP Clinical determine whether an Event Is a Treatment Emergent Adverse Event?
.
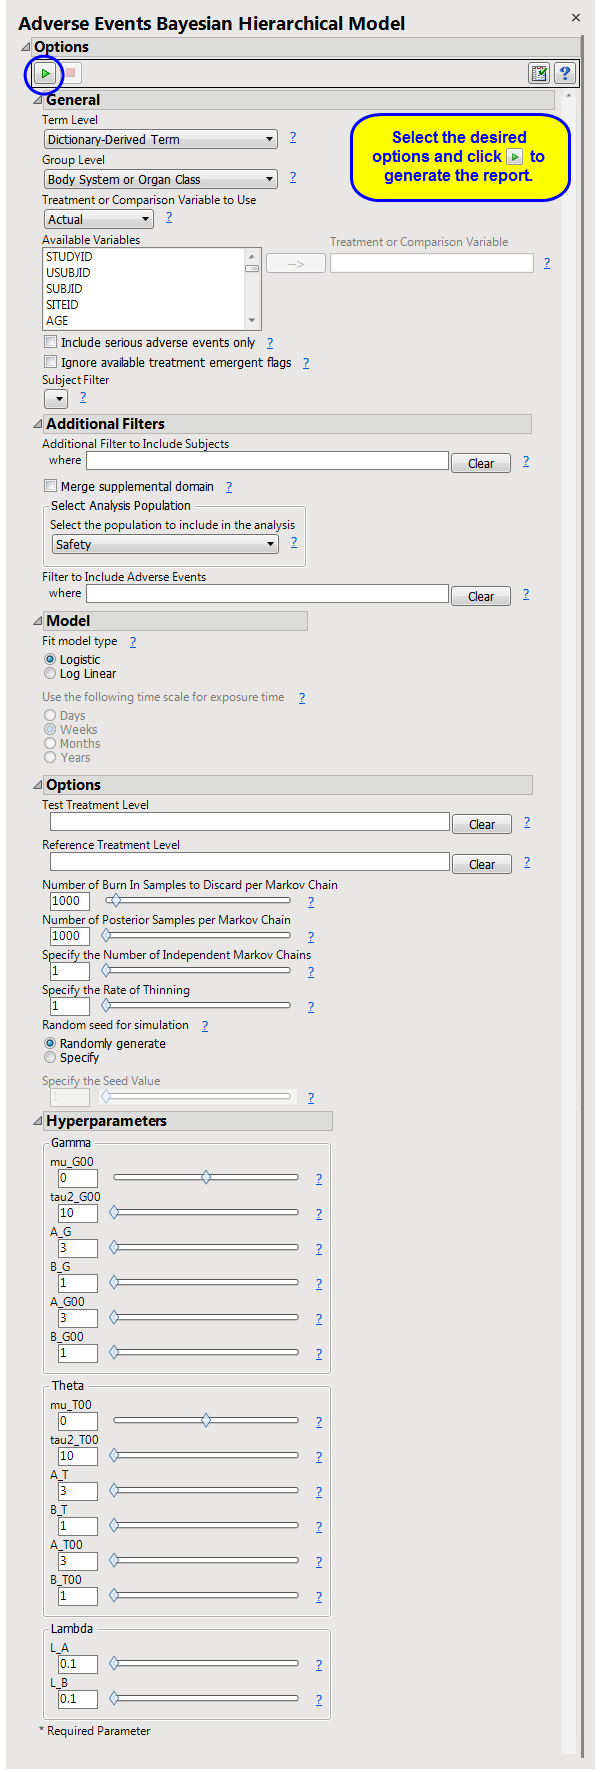
Number of Burn In Samples to Discard per Markov Chain
,
Number of Posterior Samples per Markov Chain
Xia, H.A., Ma, H., and Carlin, B.P. (2011). Bayesian Hierarchical Modeling for Detecting Safety Signals in Clinical Trials.
Journal of Biopharmaceutical Statistics
21
, 1006-1029.
Subject-specific filters must be created using the
Create Subject Filter
report prior to your analysis.
For more information about how to specify a filter using this option, see
The SAS WHERE Expression
.