This report displays
shift plots
to compare test measurements for a specified findings domain at baseline versus on-therapy values and performs a
matched pairs analysis
on average score during baseline and a summary score during the trial. A separate analysis is done for each findings measurement.
Note
: JMP Clinical uses a special protocol for data including non-unique Findings test names. Refer to
How does JMP Clinical handle non-unique Findings test names?
for more information.
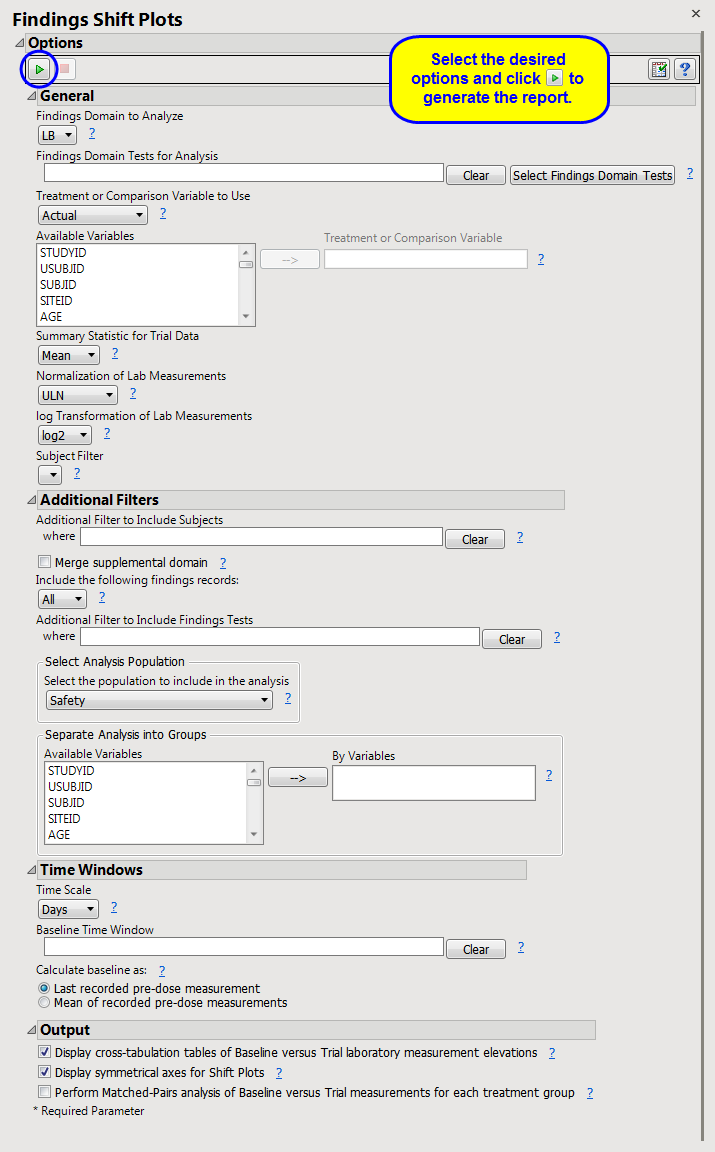
Running
Findings Shift Plots
for
Nicardipine
using default settings generates the report shown below.
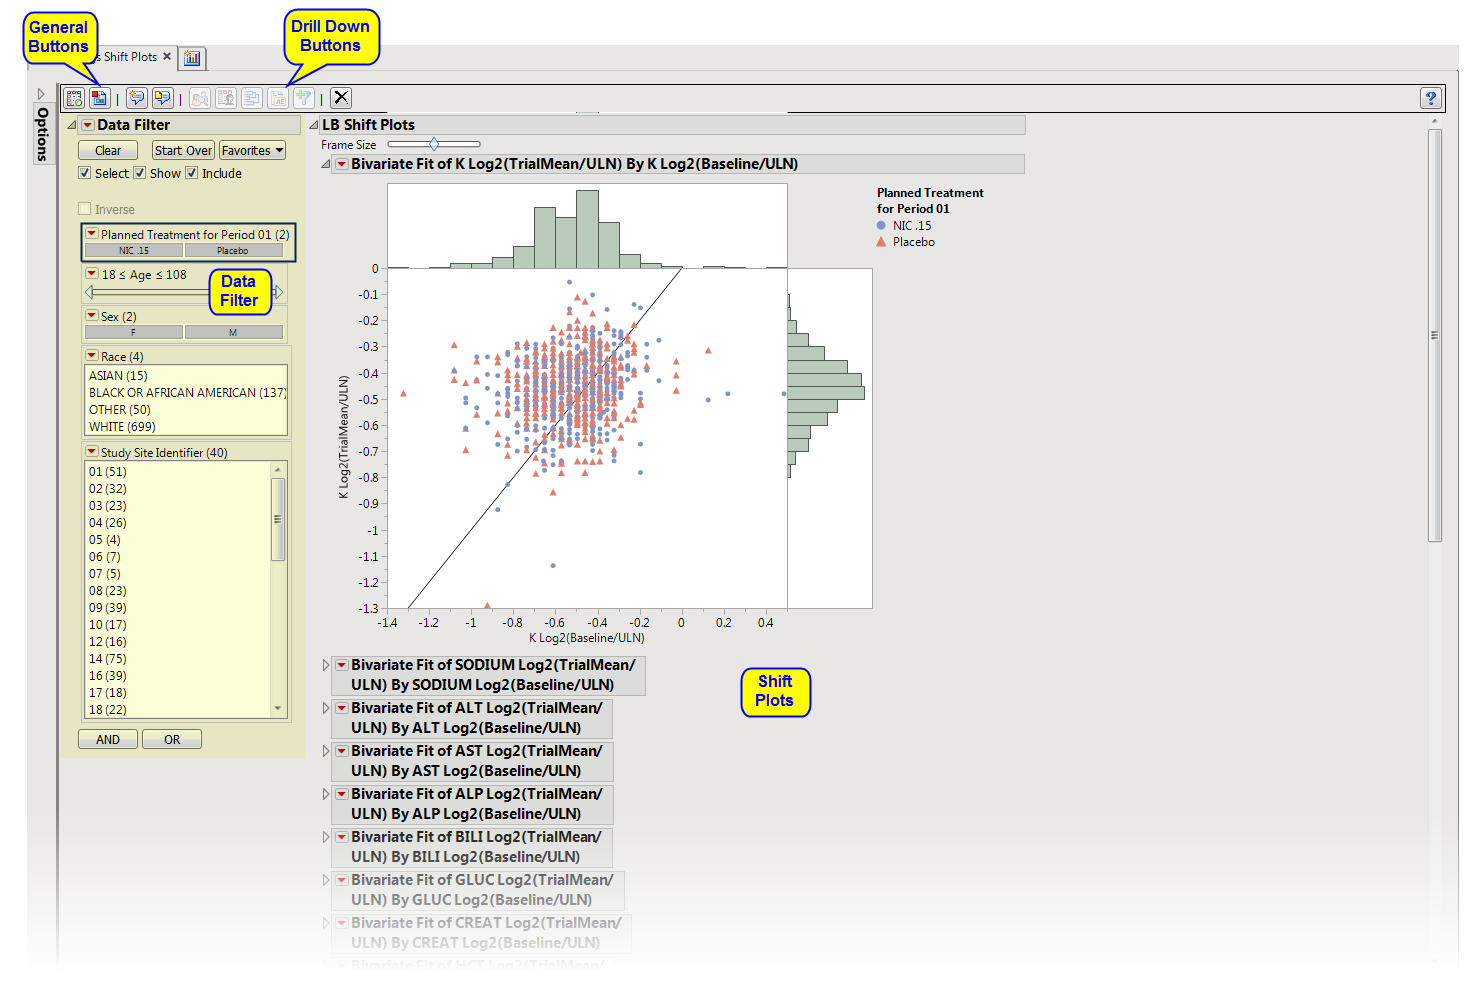

|
•
|
These plots show how findings levels change from baseline values as a result of treatment.
Blue
points represent patients treated with nicardipine.
Red
points represent patients receiving the placebo. The approximately square spread of points (with a diagonal line splitting approximately even across it) indicates similar variability of measurements before and after treatment, although the placebo group appears to have greater variability in both cases compared to the treatment group (due to outliers).
Note
: This section is generated only if the
Display cross-tabulation tables of Baseline versus Trial laboratory measurement elevations
box is checked on the report
dialog
.
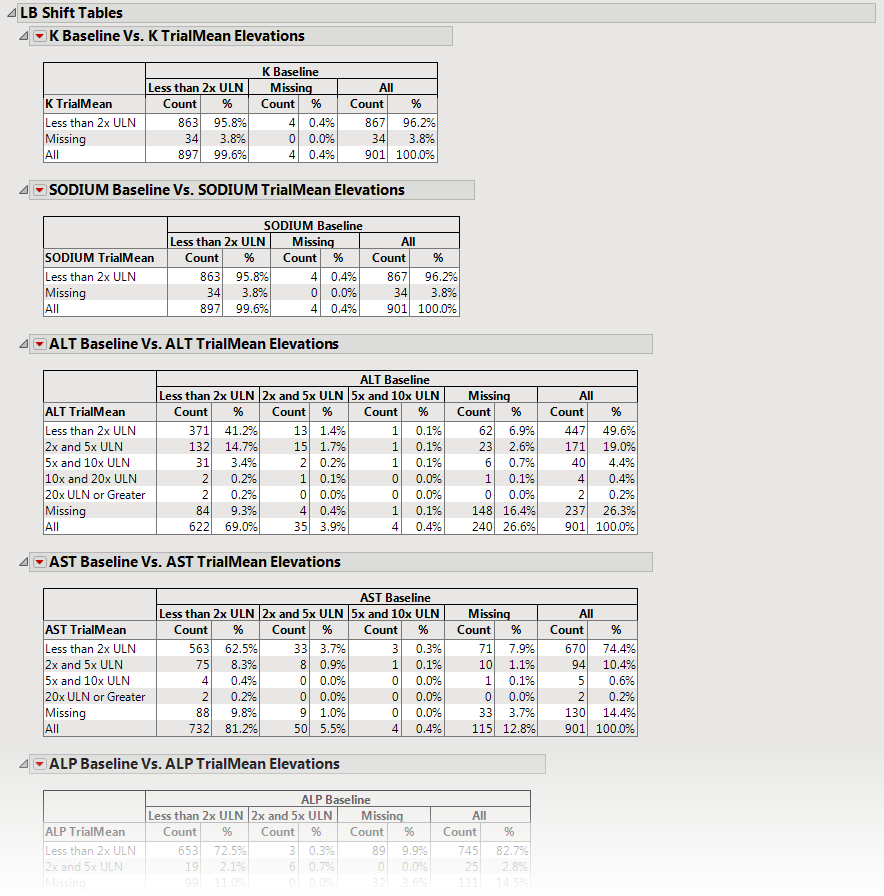
These tables contain subject counts and percentages (for each treatment group) of laboratory elevations in reference to the upper limit of normal (
LBSTNRHI
) for measurements taken at baseline versus trial summary measurements. Each table can be interpreted as a categorized representation of the shift from baseline.
Tip
: You can select table cells to view the corresponding subjects and their locations in the respective shift and matched pairs plots. (See
LB Shift Plots
and
LB Matched Pairs
for more information about the sections containing those plots.)
All tables are associated with the
Local Data Filter
(located on the
right
side). You can use this filter to subset the tables based on
variable
filters. You can select cells of these tables (either counts or percents) to select the corresponding rows in the data table.

|
•
|
A set of
Matched Pairs Analysis
Plots.
|
Each
Matched Pairs Analysis
Plot set compares the different treatment groups for each finding.
Blue
dots (
left
) represent patients treated with nicardipine.
Red
dots (
right
) represent patients treated with the placebo. In the example shown above, nicardipine appears to have little effect on individual potassium level or variation of potassium level between patients.
This enables you to subset subjects based on demographic characteristics and study site. Refer to
Data Filter
for more information.
|
•
|
Profile Subjects
: Select subjects and click
|
|
•
|
Show Subjects
: Select subjects and click
|
|
•
|
Cluster Subjects
: Select subjects and click
|
|
•
|
AE Narrative
: Select subjects and click
|
|
•
|
Demographic Counts
: Select subjects and click
|
|
•
|
Click
|
|
•
|
Click
|
|
•
|
Click
|
|
•
|
Click
|
|
•
|
Click the
arrow to reopen the completed dialog used to generate this output.
|
|
•
|
Click the gray border to the left of the
Options
tab to open a dynamic report navigator that lists all of the reports in the review. Refer to
Report Navigator
for more information.
|
Summary Statistic for Trial Data
,
Normalization of Lab Measurements
,
log Transformation of Lab Measurements
Additional Filter to Include Subjects
2
,
Merge supplemental domain
,
Include the following findings records:
,
Additional Filter to Include Findings Tests
,
Select the population to include in the analysis
,
By Variables
Display cross-tabulation tables of Baseline versus Trial laboratory measurement elevations
,
Display symmetrical axes for Shift Plots
Subject-specific filters must be created using the
Create Subject Filter
report prior to your analysis.
For more information about how to specify a filter using this option, see
The SAS WHERE Expression
.