This report creates waterfall plots to show the
distribution
of changes in test measurements for a given Findings domain across subjects (ordered by their magnitude of change). The Findings measurements are summarized based on a specified summary statistic and a waterfall plot is created for each Findings test.
Note
: JMP Clinical uses a special protocol for data including non-unique Findings test names. Refer to
How does JMP Clinical handle non-unique Findings test names?
for more information.
Running
Findings Waterfall Plots
with the
Nicardipine
sample setting and
LB
findings domain generates the report shown below.

There is one
Waterfall Plot
for each quantitative findings test (for example, laboratory tests) in the Findings data set that was analyzed. Output data set is a
stacked data set
of findings measurements at subject level; subject level drill downs available.
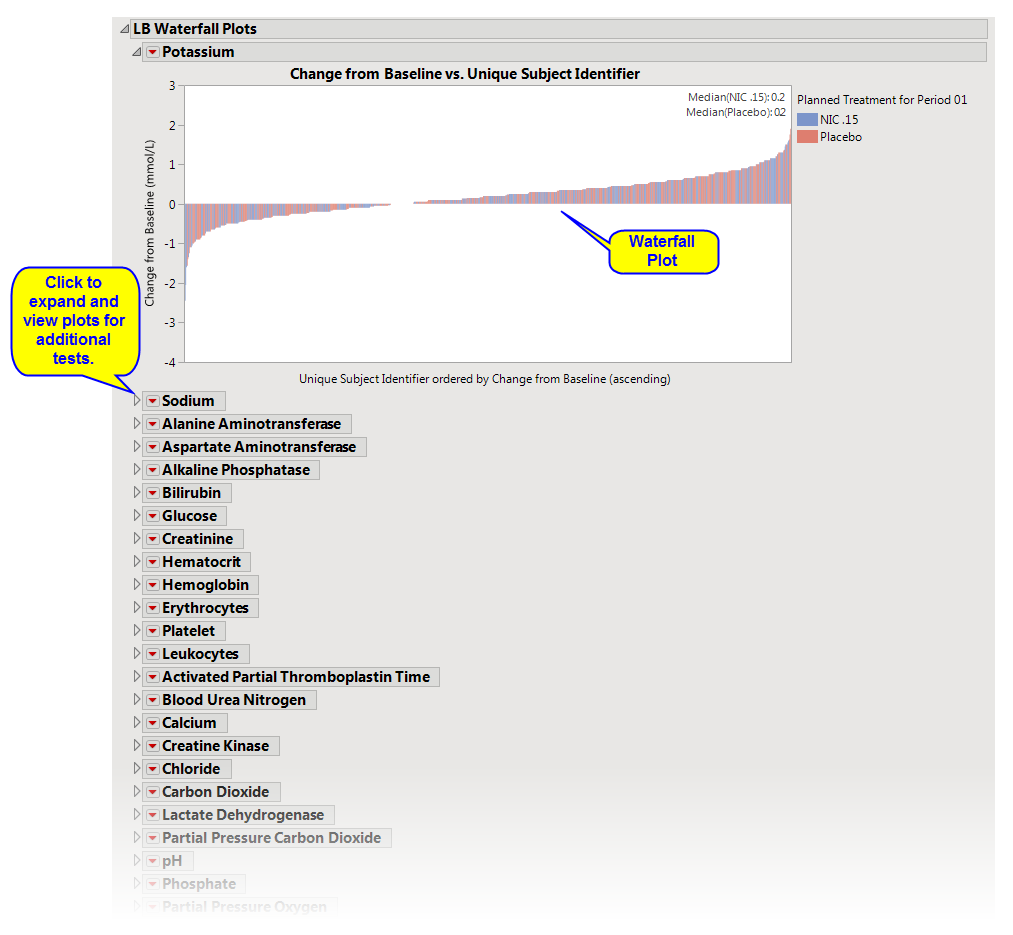
There are a series of plots. Each plot shows a summary of the findings test measurements on the
Y
axis for each subject (on
X
axis) ordered by that measurement. Caption boxes in the upper right corner of each graph (optional) display a summary statistic across all subjects (in a treatment or
BY variable
group) to aid in understanding the differences in the center/spread of the group
distributions
.
This enables you to subset subjects based on demographic characteristics and other factors. Refer to
Data Filter
for more information.
|
•
|
Profile Subjects
: Select subjects and click
|
|
•
|
Show Subjects
: Select subjects and click
|
|
•
|
Cluster Subjects
: Select subjects and click
|
|
•
|
Demographic Counts
: Select subjects and click
|
|
•
|
Click
|
|
•
|
Click
|
|
•
|
Click
|
|
•
|
Click
|
|
•
|
Click the
arrow to reopen the completed report dialog used to generate this output.
|
|
•
|
Click the gray border to the left of the
Options
tab to open a dynamic report navigator that lists all of the reports in the review. Refer to
Report Navigator
for more information.
|
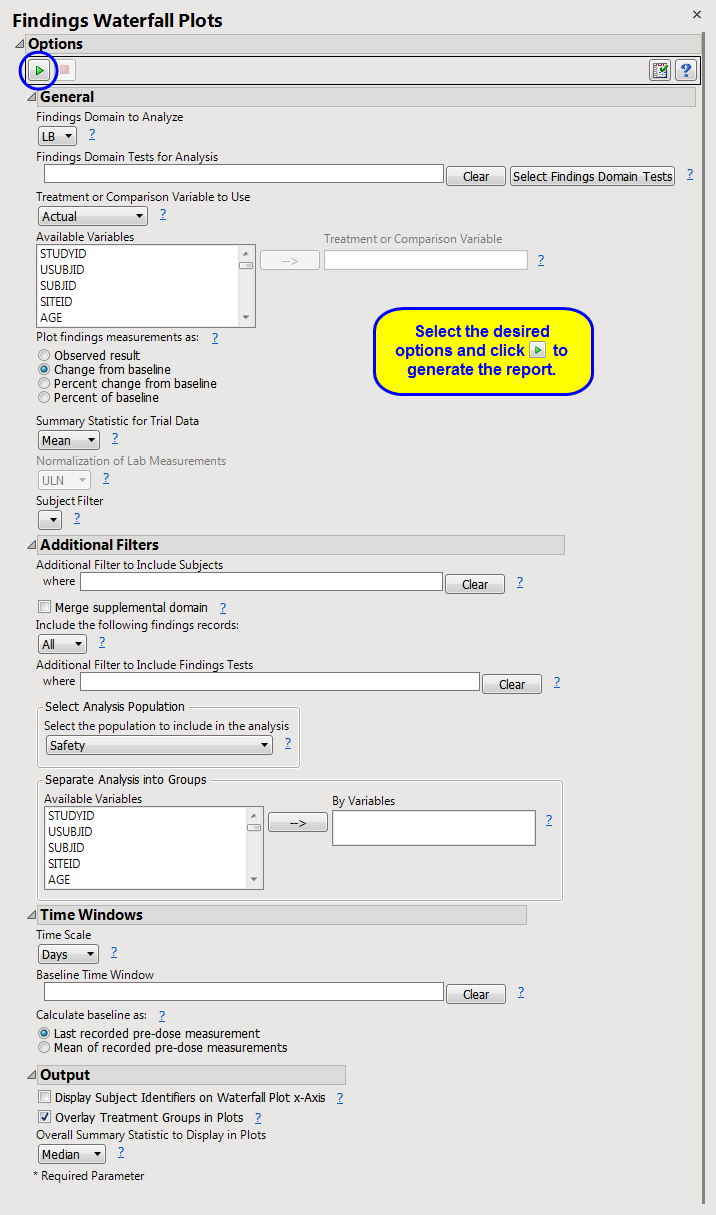
Findings Domain to Analyze
,
Findings Domain Tests for Analysis
,
Treatment or Comparison Variable to Use
,
Treatment or Comparison Variable
Plot findings measurements as:
,
Summary Statistic for Trial Data
,
Normalization of Lab Measurements
Additional Filter to Include Subjects
2
,
Merge supplemental domain
,
Include the following findings records:
,
Additional Filter to Include Findings Tests
,
Select the population to include in the analysis
,
By Variables
Display Subject Identifiers on Waterfall Plot x-Axis
,
Overlay treatment groups in plots
,
Overall Summary Statistic to Display in Plots
Subject-specific filters must be created using the
Create Subject Filter
report prior to your analysis.
For more information about how to specify a filter using this option, see
The SAS WHERE Expression
.