FDR
p
-values are calculated and the reference line is determined as described in
How does JMP Clinical calculate the False Discovery Rate (FDR)?
.
Note
: JMP Clinical uses a special protocol for data including non-unique Findings test names. Refer to
How does JMP Clinical handle non-unique Findings test names?
for more information.
Note
:
xxTPT
should not have any visit-specific information in it, or it is liable to prevent a match using BY variables.
The
Report
contains the following elements:
|
•
|
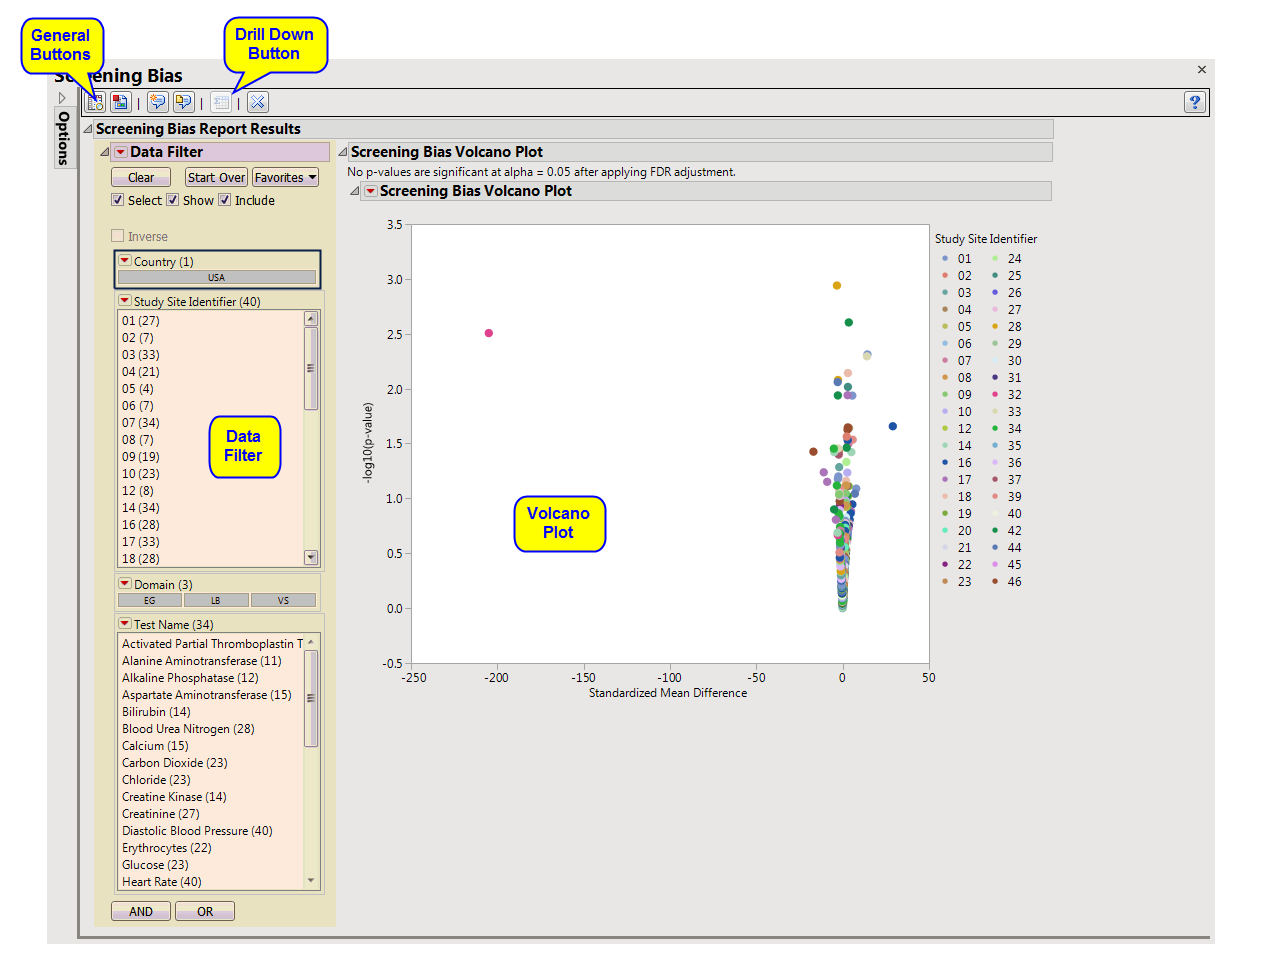
One
Data Filter
.
|
Enables you to subset subjects based on country of origin, study site and/or Test. Refer to
Data Filter
for more information.
|
•
|
One
Volcano Plot
. Shows a volcano plot used to find records where findings change significantly between one visit and the next. Screening bias compares all numerical variables. These ranges can be quite different from one another, so to summarize all of the variables in one plot, they are centered around 0 and scaled on the
X
axis using the standardized mean difference, which is:

|
This is the paired
t
-statistic which has
n
-1 degrees of freedom. When
n
is fixed, as it should be for all measurements coming from a site (unless there are missing data), all tests should have
n
measurements.
Screening Bias generates a number of paired
t
-test statistics, one for each Findings test for a specific site. These become significant as we depart from 0. Sets of values seem to have smooth curves here because the deviation from zero slows down as the difference gets larger and larger.
Each point represents a single Findings test for a specific site. You can mouse over points of interest to see their labels or select points by dragging a mouse rectangle over them (as shown above). Selected rows are highlighted in other plots and you can also then click on various
Down Buttons
for further analyses on those specific sites.

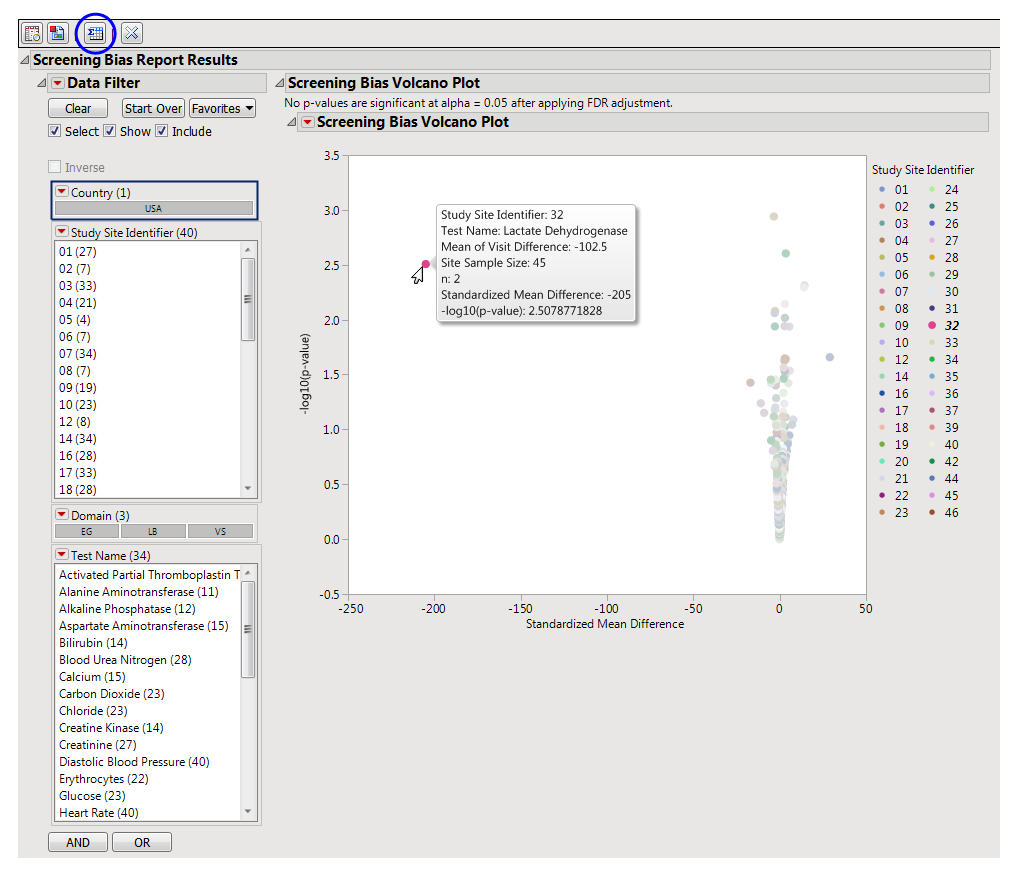
A very large
Visit 1 - Visit 2
difference (increase) has been identified for lactate dehydrogenase for site 32. Visit 1 mean = 338.5 Visit 2 mean = 441 with Mean of V1 minus V2 Differences = -102.5. So there is an increase of 102.5 units which divided by the standard error gives a standardized difference of -205. This is a large change considering the observed variability and suggests further investigation.
|
•
|
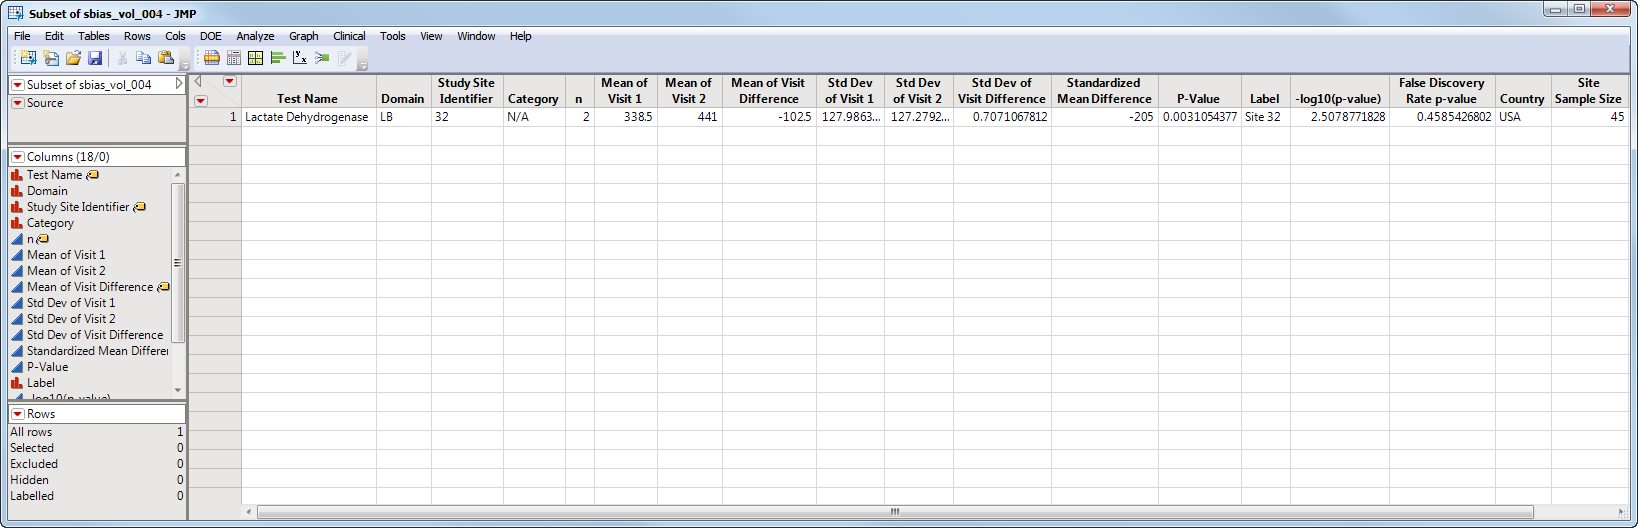
Show Summary Statistics
: Shows the rows of the data table for the selected points from the
volcano plot
. Clicking
|
|
•
|
Click
|
|
•
|
Click
|
|
•
|
Click
|
|
•
|
Click
|
|
•
|
Click the
arrow to reopen the completed report dialog used to generate this output.
|
|
•
|
Click the gray border to the left of the
Options
tab to open a dynamic report navigator that lists all of the reports in the review. Refer to
Report Navigator
for more information.
|
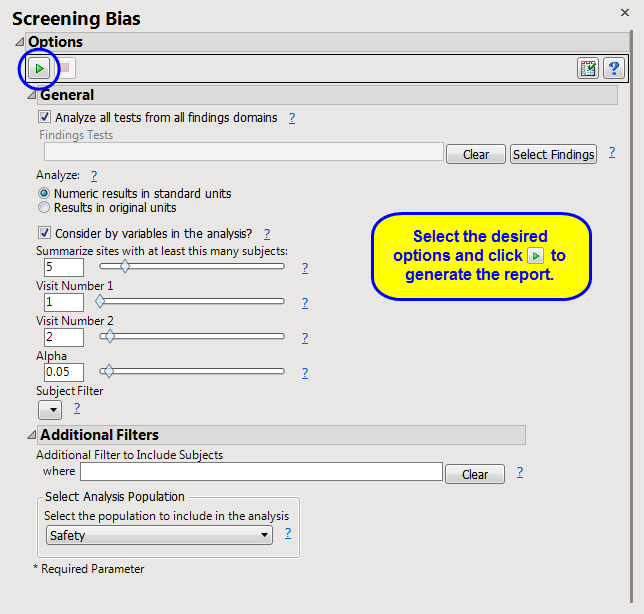
Analyze all tests from all findings domains
,
Findings Tests
,
Analyze:
,
Consider BY variables in the analysis
Subject-specific filters must be created using the
Create Subject Filter
report prior to your analysis.
For more information about how to specify a filter using this option, see
The SAS WHERE Expression
.