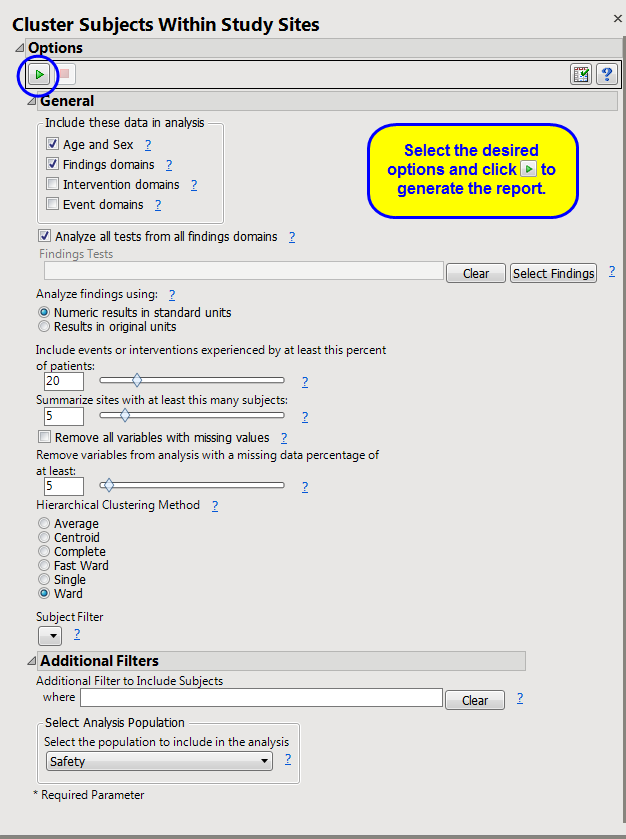
Cluster Subjects within Study Sites
clusters subjects within study site for the purpose of identifying similar subjects. It constructs a cross domain data set using as much data as possible (subject to user options). Next, it calculates Euclidean distances to compute a
distance matrix
and performs
hierarchical clustering
of subjects within each study center. Findings values are averaged by
USUBJID
, test code, visit number, and time point (if available) if there are multiple measurements for a visit or time point. The goal of this exercise is to identify pairs of subjects with a very small distance. This could be an indication that these subject are slightly modified copies of one another.
Running this report for
Nicardipine
using default settings generates the report shown below.
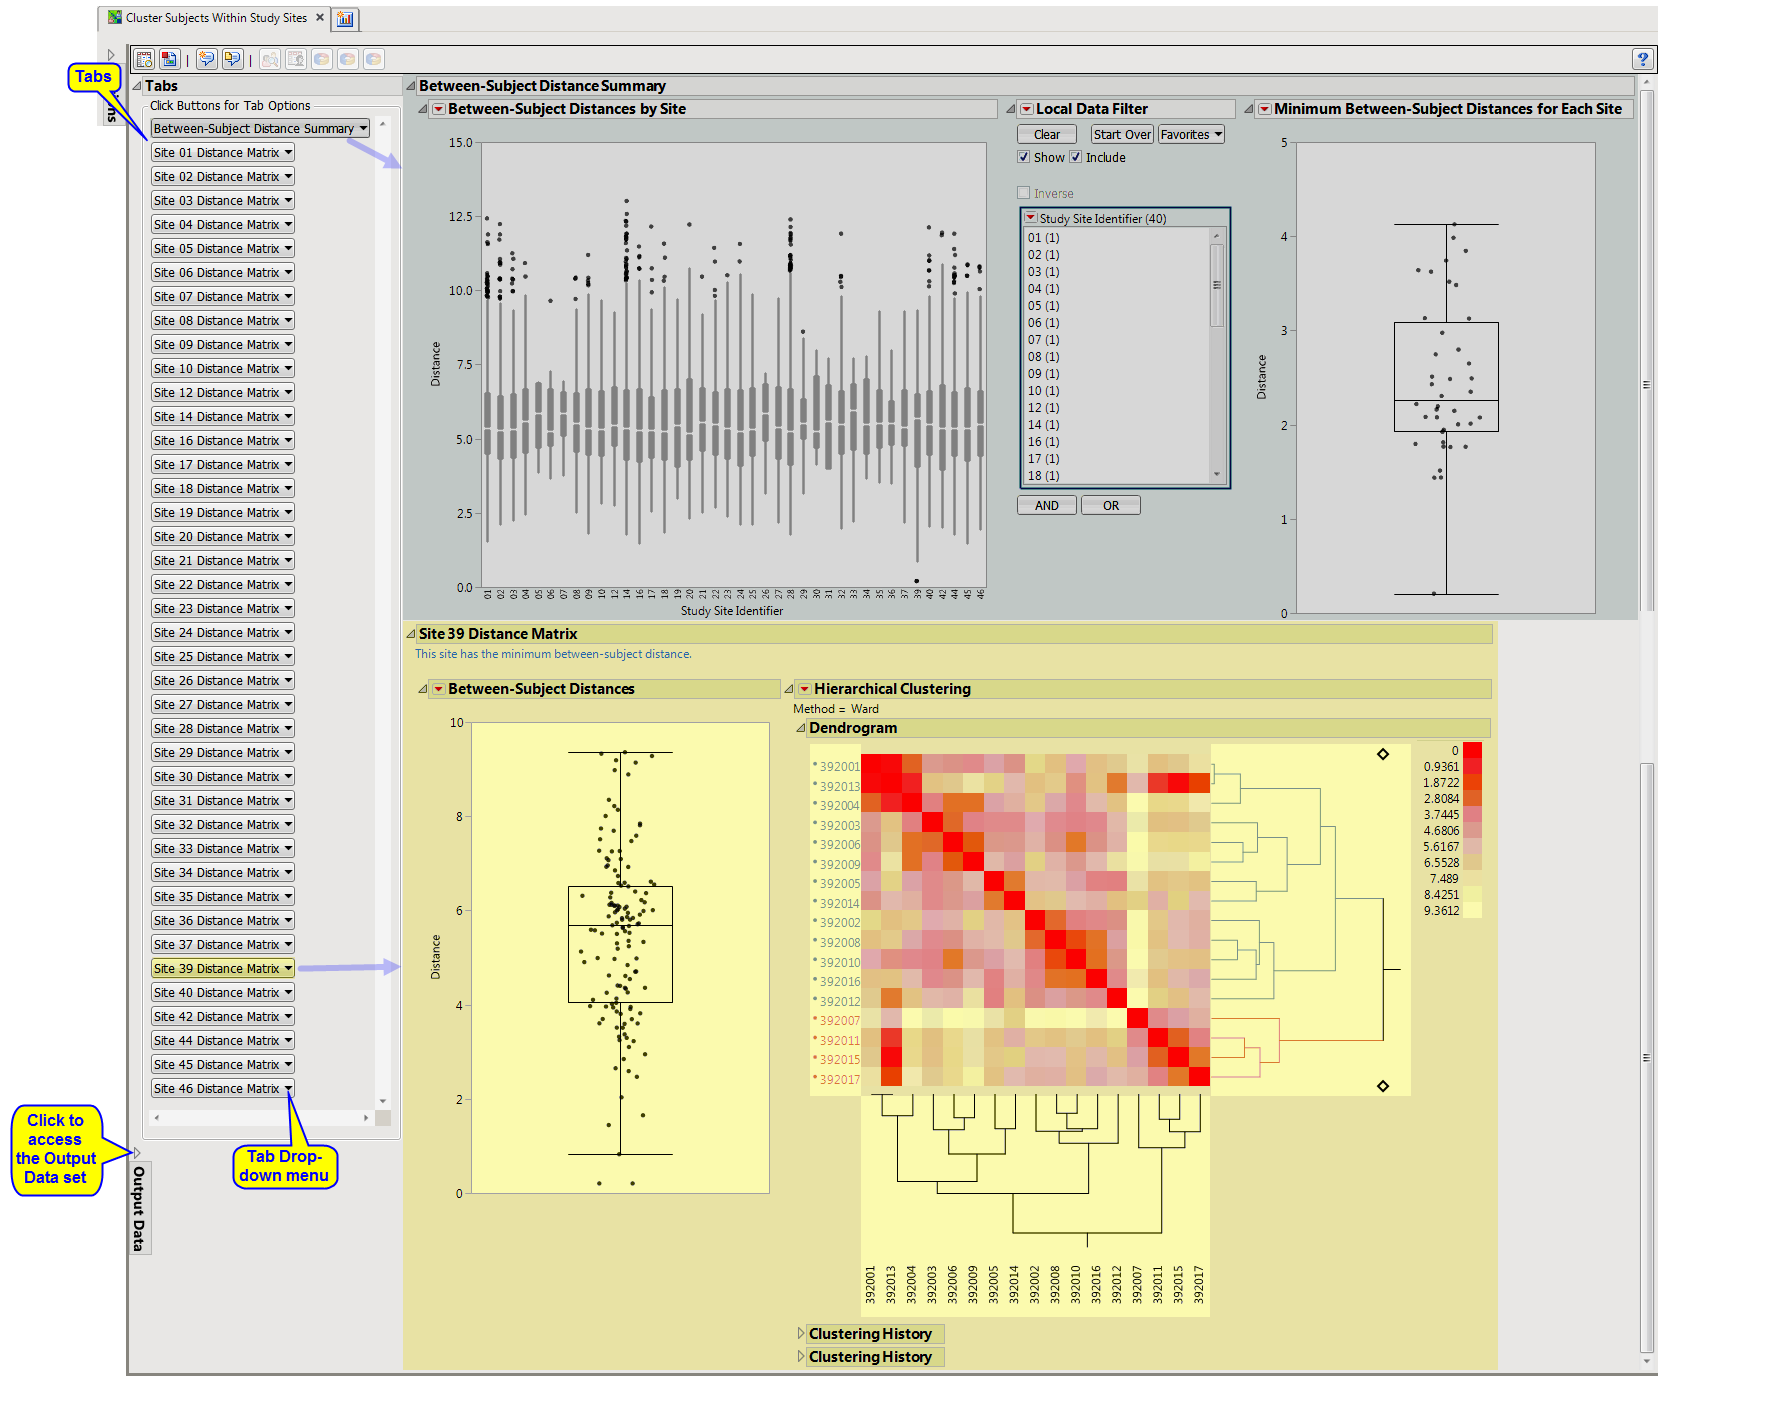
The
Cluster Subjects Within Study Sites
report shows the results of clustering of the subjects on the basis of different combinations of covariates. The results for each grouping are presented in a separate “section”.
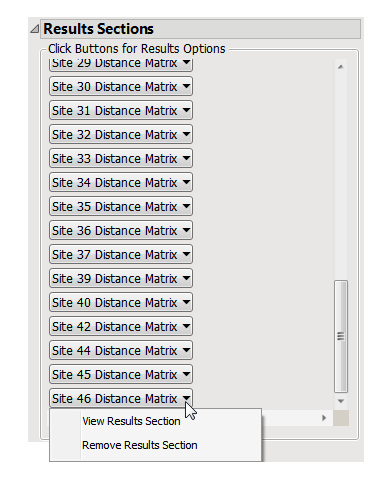
This pane enables you to access and view the output plots and associated data sets on each section. Use the drop-down menu to view the section in the
Results
pane or remove the section and its contents from the
Results
pane.
Note
: You might need to expand this pane to surface a scroll bar if the number of sections exceeds the spaces allotted.
This section presents
box plots
of the pairwise Euclidian Distances between subjects presented by site. The Euclidian Distance is calculated within study site. A
Box Plot
of the minimum pairwise distance taken from each site presented is shown below.
|
•
|
This figure shows
box plots
of all pairwise Euclidian distances within each study site. Values closer to
zero
(0) reflect subjects that are very similar to one another, which could indicate that they are slightly modified copies.
This enables you to subset subjects based by study site. Refer to
Data Filter
for more information.
|
•
|
One Box Plot of
Minimum Between-Subject Distances for Each Site
.
|
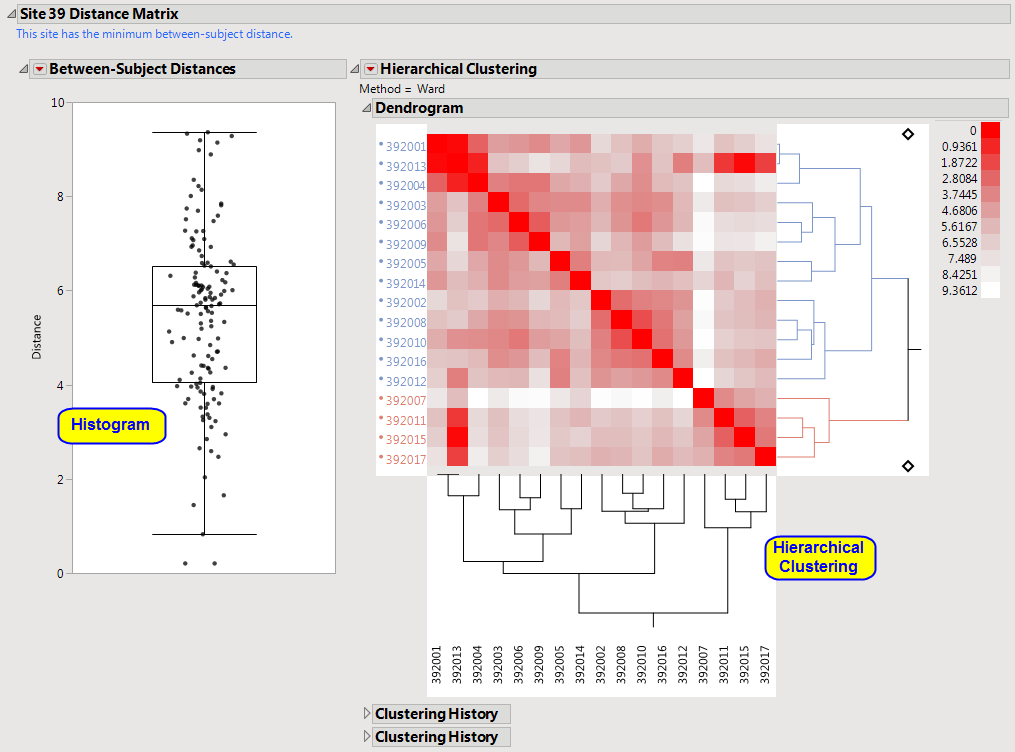
The
Site XX Distance Matrix
section is shown below. There is one section for each study site in the trial. However, only the site with the minimum pairwise distance is initially opened to minimize effects on performance. A box plot of all pairwise distances is presented as well as a
Heat Map and Hierarchical Clustering
display (using the
Average
method) to determine whether there are sets of subjects that are very similar.
|
•
|
One
Box Pot
|
Summarizes the
distribution
of all pairwise Euclidian distances within site XX. Small pairwise distances can be selected in the
Box Plot
and highlighted in the
Hierarchical Clustering Heat Map
with the
button.
|
•
|
One
Hierarchical Clustering
display.
|
Clusters subjects based on the pairwise Euclidian distances summarized in the
box plot
. Bluer color indicates subjects that are more similar, whereas red shows subjects less similar. The
clustering
dendrogram
is presented to the right of the heat map and can show sets of more than two subjects that are similar to one another.
|
•
|
Profile Subjects
: Select subjects and click
|
|
•
|
Show Subjects
: Select subjects and click
|
|
•
|
Show Rows in Heat Map
: Select points that represent pairs of subjects in the
Box Plot
s
and click
|
|
•
|
Subset Clustering
: On a subgroup
clustering
page, subsets clustering to subjects, based on pairs selected from corresponding box plot.
|
|
•
|
Revert Clustering
: Click
|
|
•
|
Click
|
Output includes one summary data set (named
cswss_sum_XXX
1
, by default) containing one record per subject with selected data, one data set of all pairwise distances within the site (named
cswss_alldist_XXX
, by default), one data set containing minimum pairwise distances for each site (named
cswss_mindist_XXX
), by default), one data set per site containing pairwise distances (named
cswss_p_Y_XXX
, by default, where
Y
is site number or indexed 1 to the number of sites) and one data set per site containing the
distance matrix
of subjects within the
covariate
subgroup (named
cswss_Y_XXX
, by default, where
Y
is site number or indexed 1 to the number of sites).
|
•
|
Click
|
|
•
|
Click
|
|
•
|
Click
|
|
•
|
Click the
arrow to reopen the completed report dialog used to generate this output.
|
|
•
|
Click the gray border to the left of the
tab to open a dynamic report navigator that lists all of the reports in the review. Refer to
Report Navigator
for more information.
|
No testing is performed. Subjects are clustered within each site according to the selected clustering methodology. See statistical details for
hierarchical clustering
in the JMP documentation.
Remove all variables with missing values
,
Remove variables from analysis with a missing data percentage of at least:
The
_XXX
designation is used to designate a one- to three-digit number that is added sequentially to prevent overwriting of existing data sets.
Subject-specific filters must be created using the
Create Subject Filter
report prior to your analysis.
For more information about how to specify a filter using this option, see
The SAS WHERE Expression
.