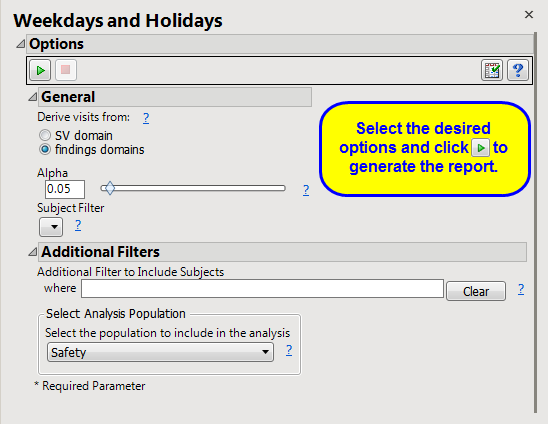
Running this report with the
Nicardipine
sample setting and default options generates the output shown below.
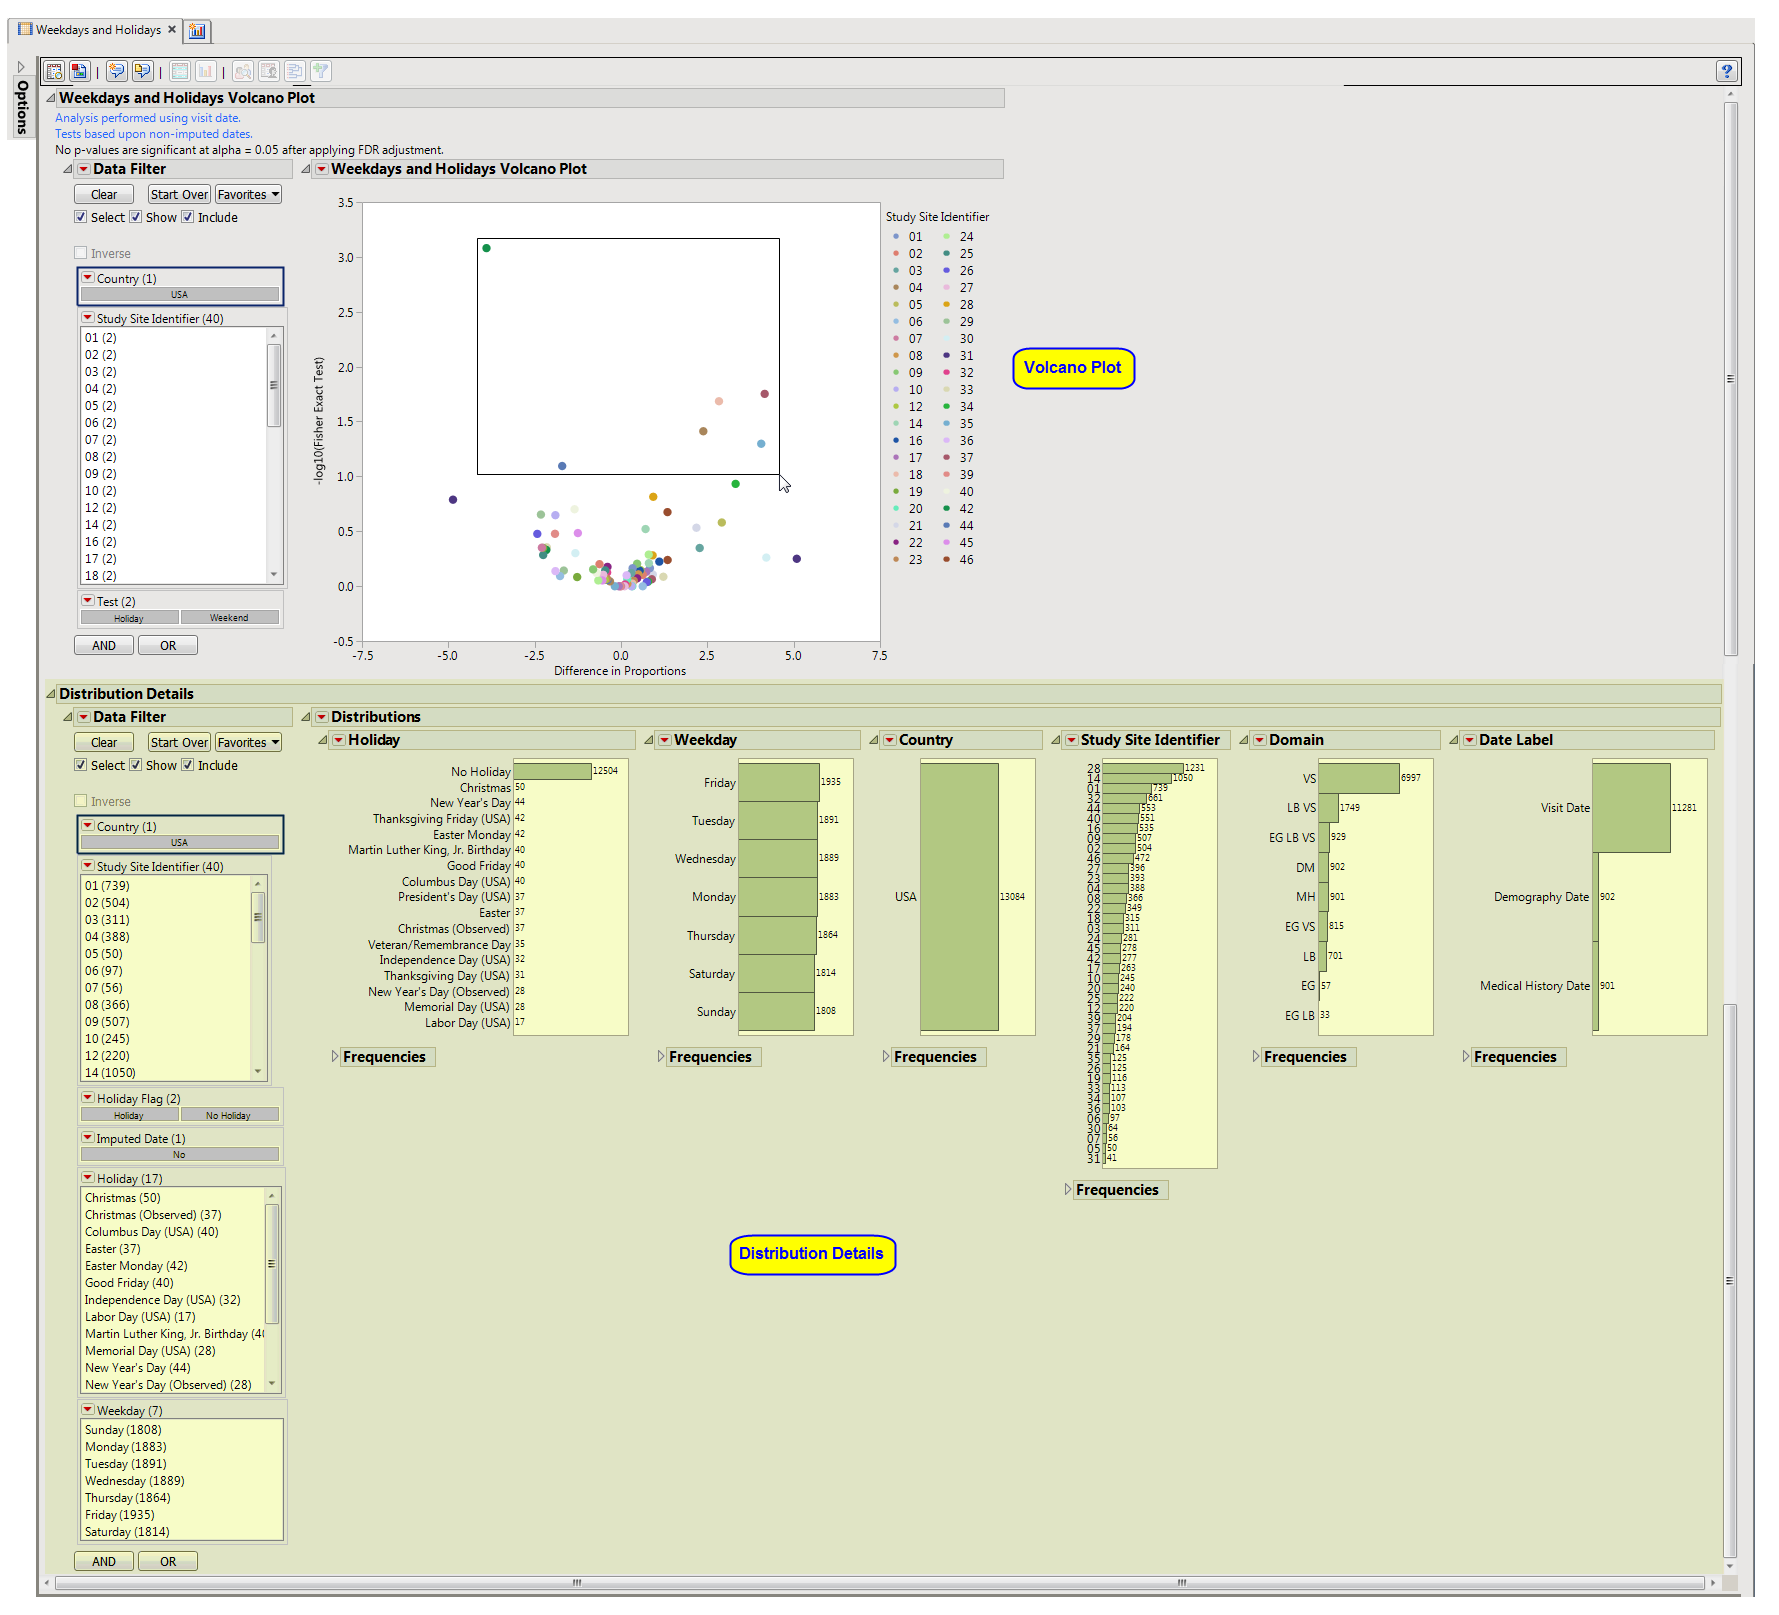
The
Weekdays and Holidays
report initially shows a Weekdays and Holidays Volcano Plot and the
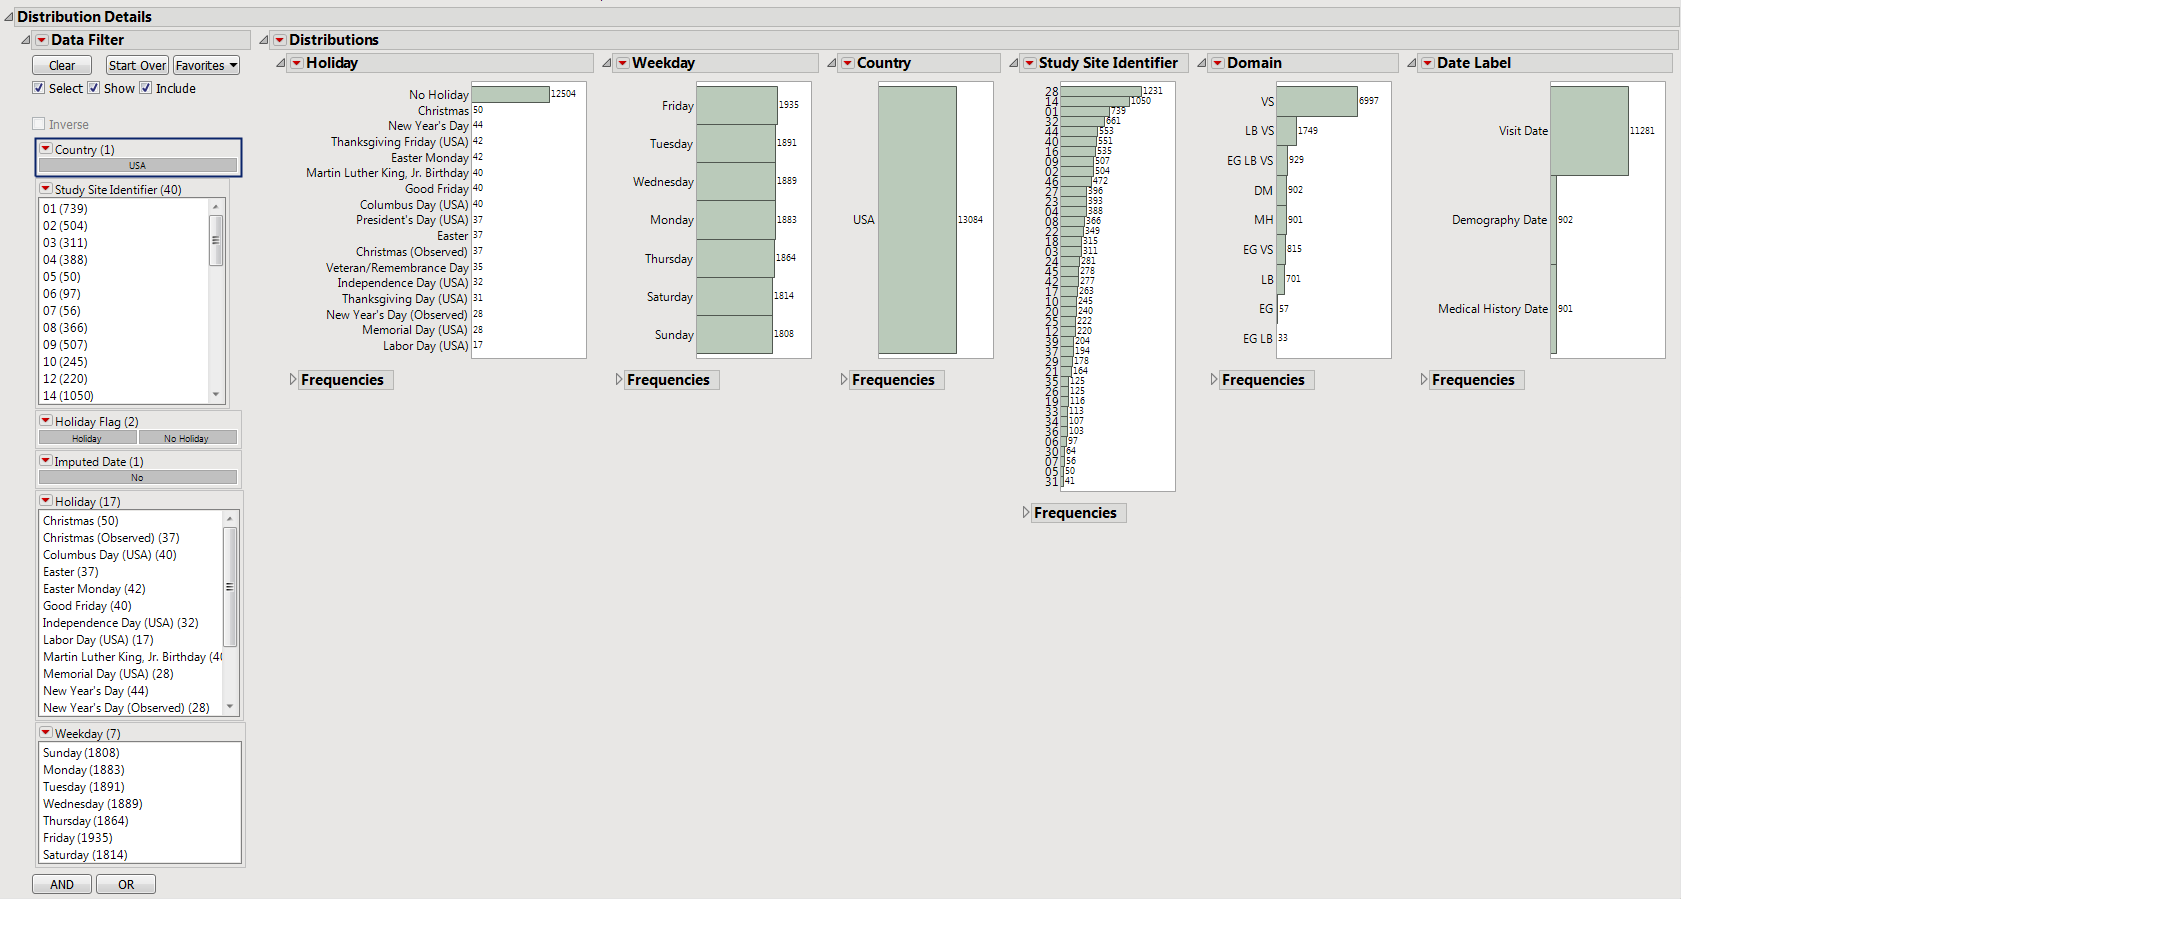
Distribution Details
.
Note
: In those instances where a study is conducted at one site only, no volcano plot is generated.

|
•
|
One
Data Filter
.
|
Enables you to subset subjects based on country of origin and study site. Refer to
Data Filter
for more information.
|
•
|
See
Volcano Plot
for more information.
Summarizes several
Histogram
s
describing characteristics of visit dates, demography dates, and medical history dates.
|
•
|
Histograms detail the levels and frequencies of
Holiday
s, Day of Week (
Weekday
),
Country
of Study Site,
Study Site identifier
, and
Date Label
(whether the date refers to a
Visit Date
or the date
Medical History
or
Demography
information are collected).
See
Distribution
for more information.
|
•
|
One
Data Filter
.
|
Enables you to subset subjects based on country of origin, study site, and holidays and weekdays.. Refer to
Data Filter
for more information.
|
•
|
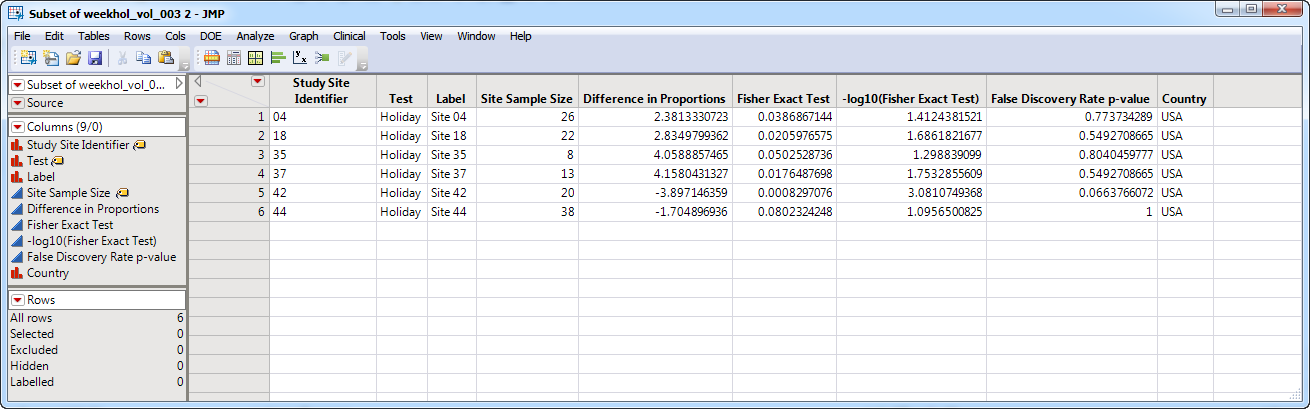
Show Sites
: Shows the rows of the data table for selected points (in this example, the points shown in the figure above) from the
volcano plot
.
|
|
•
|
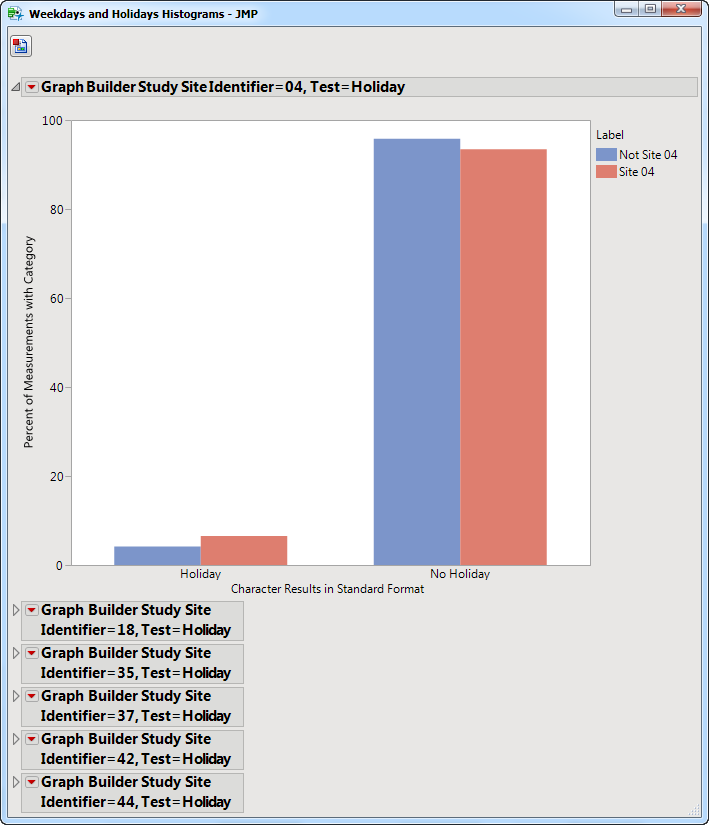
Visit Bar Charts
: For the points selected in the volcano plot, clicking
|
|
•
|
Profile Subjects
: Select subjects and click
|
|
•
|
Show Subjects
: Select subjects and click
|
|
•
|
Cluster Subjects
: Select subjects and click
|
|
•
|
Demographic Counts
: Select subjects and click
|
|
•
|
Click
|
|
•
|
Click
|
|
•
|
Click
|
|
•
|
Click
|
|
•
|
Click the
arrow to reopen the completed report dialog used to generate this output.
|
|
•
|
Click the gray border to the left of the
Options
tab to open a dynamic report navigator that lists all of the reports in the review. Refer to
Report Navigator
for more information.
|
This report compares the weekend (weekend or not) or holiday (holiday or not) status of study visit dates with each site compared to all other sites taken together as a reference. Comparisons are performed using Fisher's exact test. FDR
p
-values are calculated and the reference line is determined as described in
How does JMP Clinical calculate the False Discovery Rate (FDR)?
.
Subject-specific filters must be created using the
Create Subject Filter
report prior to your analysis.
For more information about how to specify a filter using this option, see
The SAS WHERE Expression
.