The
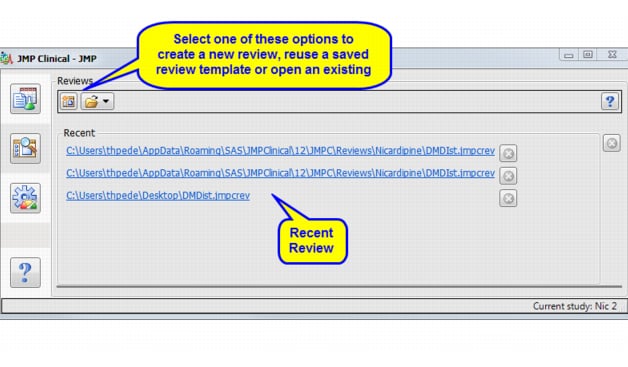
Reviews
tab (shown below) enables you to create a new review of the selected study, open an existing review, or use a template generated previously for another study to generate a review for the current study.
The
Review Builder
is used for creating a new review. It does this by first creating a template containing one or more reports that have been configured with specific options. This template can then be used for preliminary analysis and/or saved for use with subsequent analyses of the same or alternative studies
The
Review Viewer
is used
|
|
The
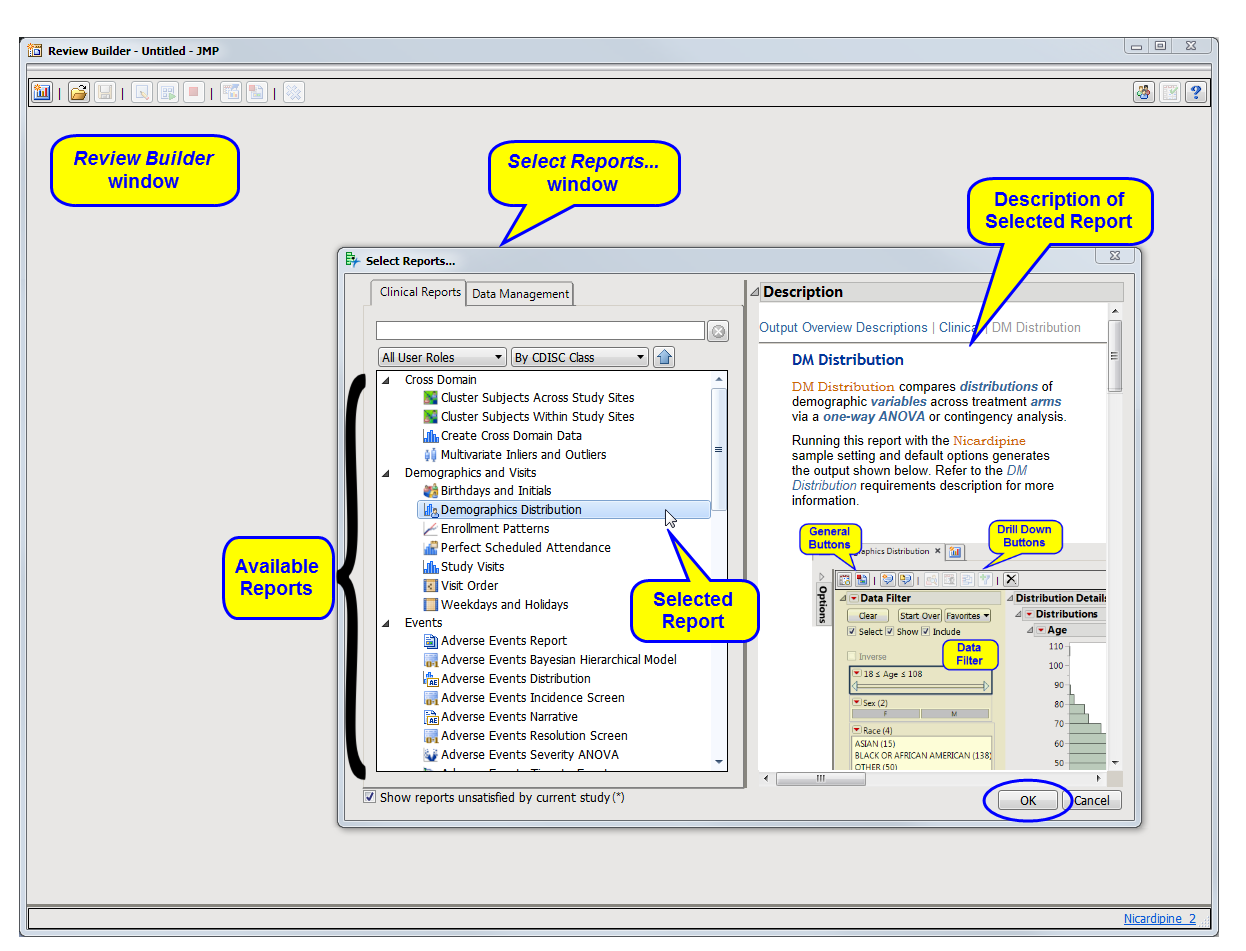
Select Reports...
window lists all of the reports that are available for analyzing the specified study. This window is used to select the reports that are to be included in the review.
Note
: Normally, only those reports whose domain/variable requirements are satisfied, and therefore can be run are shown.
Check the Show reports unsatisfied by the current study
check box to show all reports.
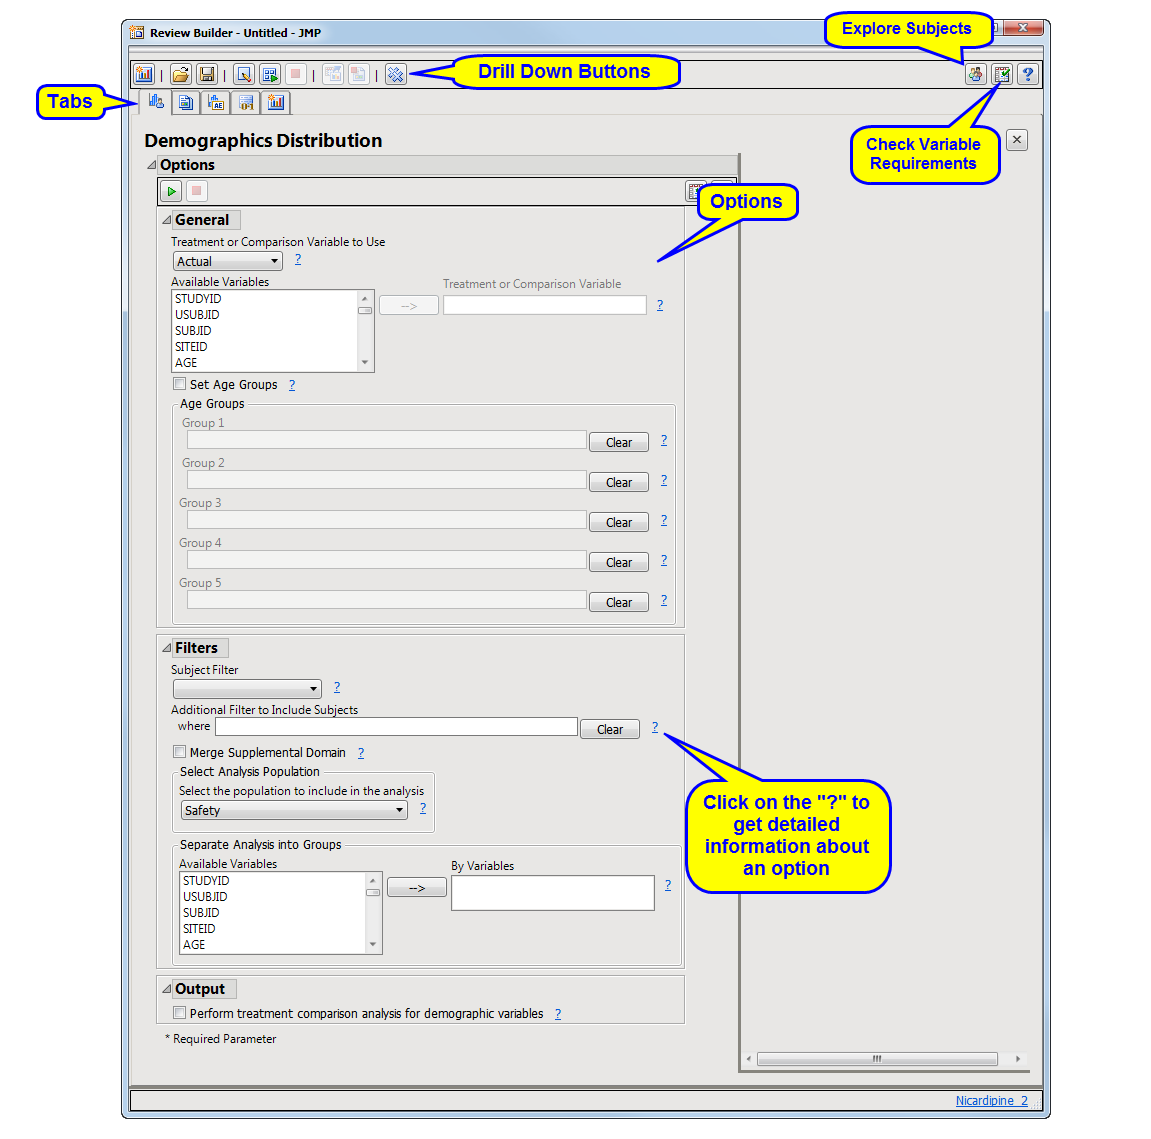
The
Review Builder
window contains all of the specified reports. There is a separate tab for each report. Initially, each tab lists the options for the analysis. You can accept the default settings or adjust them as desired. After the report(s) is run, results are shown in the tab.
The following action buttons
2
are available on the
Review Builder
to enable you to add or delete reports and run, save, or change the review.
|
•
|
Add Report
: Click
|
|
•
|
Open Review Template
: Click
|
|
•
|
Save
: Click
|
|
•
|
Manage Tabs...
Click
|
|
•
|
Run All Reports
: Click
|
|
•
|
Cancel Run
: Click
|
|
•
|
Generate Review
: Click
|
|
•
|
Create static report for Review
: Click
|
|
•
|
Clear all report results
: Click
|
|
•
|
Explore Subjects for this study
: Click
|
|
•
|
|
|
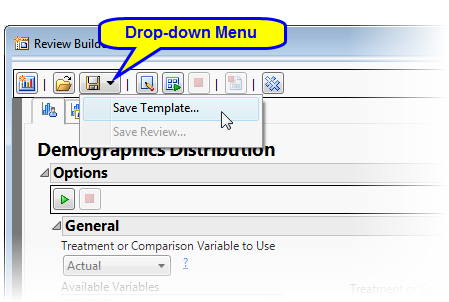
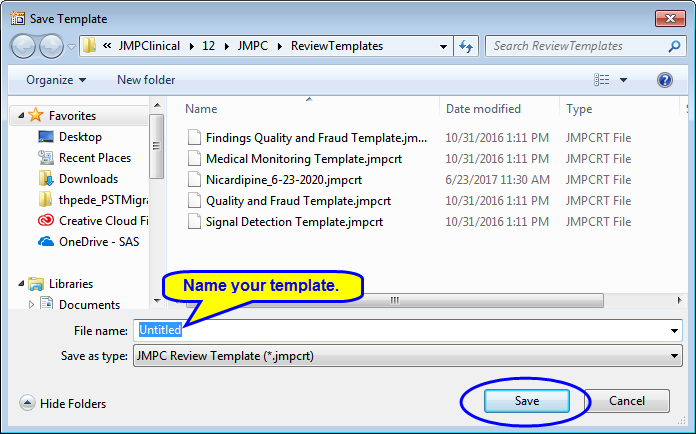
Click the drop-down menu and select
Save Template...
, as shown below:
|
 Name
Name
|
|
Provide a name for your template and click
to template with the reports and options specified
|
When you generate a review for a study, you can save the template (reports, option settings, and so on) for that review using the
Save Review Template...
action button (see above). Saved templates can be used again and again for new studies.
|
|
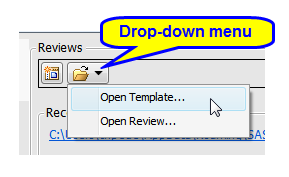
Click the drop-down menu and select
Open Template...
, as shown below:
|
|
|
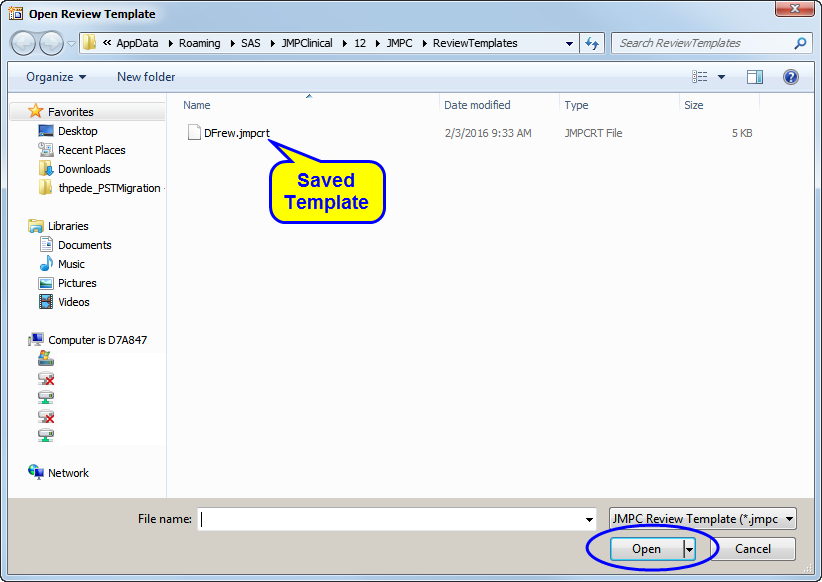
Select the desired template and click
to open the
Review Builder
window with the reports and options specified
|
|
|
Constructs a cross domain data set and computes a
distance matrix
and performs
hierarchical clustering
of subjects across all of the study centers to identify pairs of subjects with a very small distance. This could be an indication that these subjects are in fact the same individual who has enrolled at multiple sites.
|
|
|
Constructs a cross domain data set and computes a
distance matrix
and performs
hierarchical clustering
of subjects within each study center to identify pairs of subjects with a very small distance. This could be an indication that these subject are slightly modified copies of one another.
|
|
|
Adding data for various domains to the
ADSL
table corresponding to incidence of
variables
in the
AE
,
CM
,
LB
, and
MH
domains and a summary statistic for
LB
,
EG
, and
VS
domain values
|
|
|
Calculating
Mahalanobis distance
based on available data to detect subject inliers and outliers in multivariate space, and generating results by site to see which sites are extreme
|
Reports examining patient demographics and study visit attendance are described in the table below:.
|
|
|
|
|
Compares
distributions
of demographic
variables
across treatment
arms
via a
one-way ANOVA
or contingency analysis.
|
|
|
|
|
|
Compares the
distributions
of study visit days for each center compared to all other centers combined, and identifies unusual differences.
|
|
|
|
|
|
|
|
|
|
|
|
|
|
Fitting Bayesian hierarchical
models
for adverse events, while taking into account a grouping variable
|
|
|
|
|
|
Screening adverse events by performing a
Cochran-Mantel-Haenszel exact test
on all 2x2 tables constructed from incidence and treatment arm
|
|
|
|
|
|
Screening adverse events by performing a
Cochran-Mantel-Haenszel test
on all 2x2 tables constructed from event resolution and treatment arm
|
|
|
Screening adverse events by performing a
mixed-model analysis of variance
, with average ranked severity score as the
dependent variable
and customizable fixed and
random effects
|
|
|
|
|
|
Creating
Kaplan-Meier
Survival Curves
for time to study discontinuation and associated statistics, grouped by treatment arm
|
|
|
|
|
|
Screening events from a domain by performing a
Cochran-Mantel-Haenszel test
on all 2x2 tables constructed from event incidence and treatment arm
Note
: This report should be considered as
two
:
DS Incidence Screen
and
MH Incidence Screen
, depending on which domain is specified in the dialog.
|
|
|
Grouping clinical mortality results by treatment
arm
and generating
Kaplan-Meier
Survival Curves
with associated statistics
|
|
|
|
|
|
|
|
|
|
|
|
|
|
|
|
|
|
|
|
|
|
|
Screening
findings
measurements for a specified domain
one at a time
by performing a
repeated-measures analysis of variance
|
|
|
Displaying
Box Plot
s
by treatment group representing the change from baseline in measurements for each test for a specified
findings
domain across various time windows or points in a study
|
|
|
|
|
|
|
|
|
Displaying
Shift Plot
s
to compare test measurements for a specified
findings
domain at
baseline
versus
on-therapy
values, and performing a
matched pairs analysis
on average score during baseline and a summary score during the trial
|
|
|
|
|
|
Visualizing
findings
measurements across the timeline of a study
|
|
|
Creating waterfall plots to show the
distribution
of changes in test measurements for a given Findings domain across subjects
|
|
|
|
|
|
Visualizing peak values for lab measurements pertaining to
Hy’s Law
for detecting potential liver toxicity for all subjects across treatment arms
|
|
|
|
|
|
|
|
|
|
|
|
|
|
Generating an
exposure summary and plot
for all subjects in a study of an investigational product, by dose and exposure time for the safety
population
, by treatment
|
|
|
|
|
|
Screening interventions by performing a
Cochran-Mantel-Haenszel exact test
on all 2x2 tables constructed from event incidence and treatment arm
|
Click on a button corresponding to an
interventions
report. Refer to the table below for guidance.
|
|
|
|
|
|
|
|
|
|
|
|
|
|
|
|
|
Click on a button corresponding to a
subject utility
. Refer to the table below for guidance..
|
|
|
|
|
|
|
|
Checks SAS data sets in the
SDTM
and
ADaM
folders that have been specified for the selected study, for all variables required for various JMP Clinical reports.
|
|
|
|
|
|
Note
: You cannot update or otherwise alter the review.
|
|
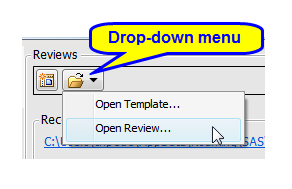
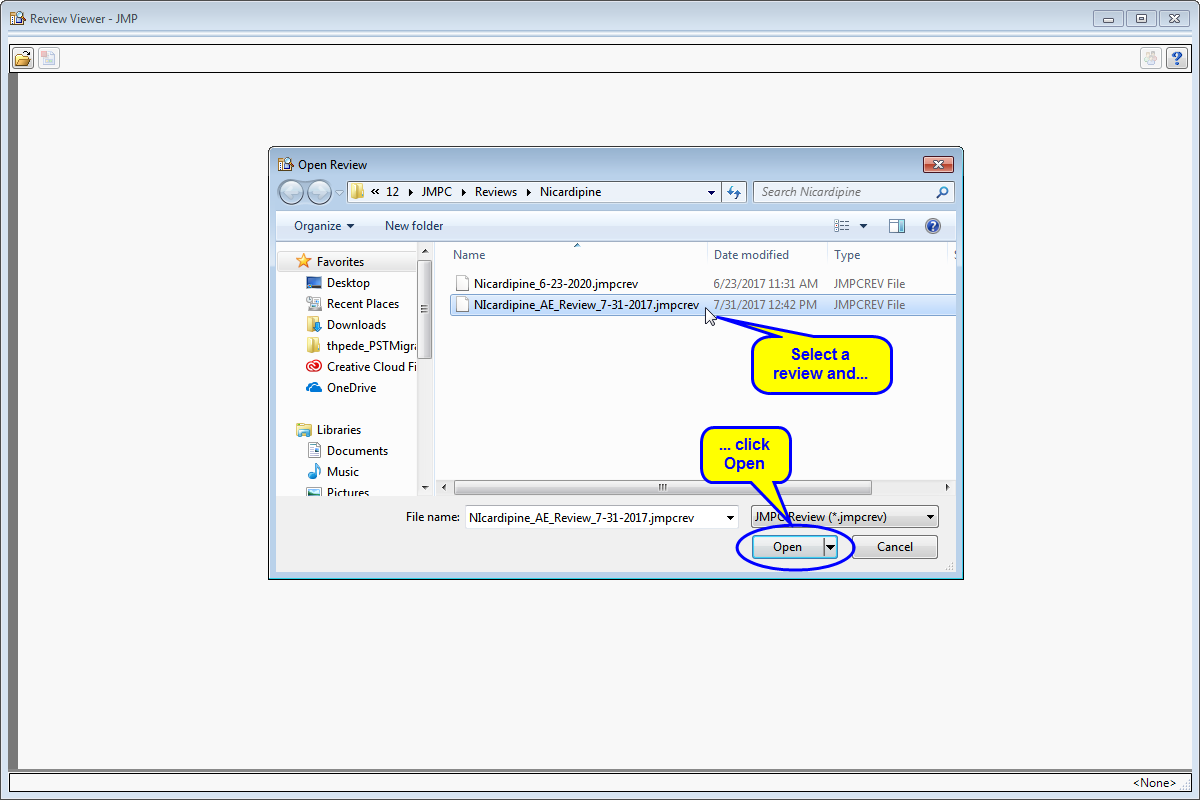
Click the drop-down menu and select
Open Review...
, as shown below:
|
The
Review Viewer
opens, as shown below:
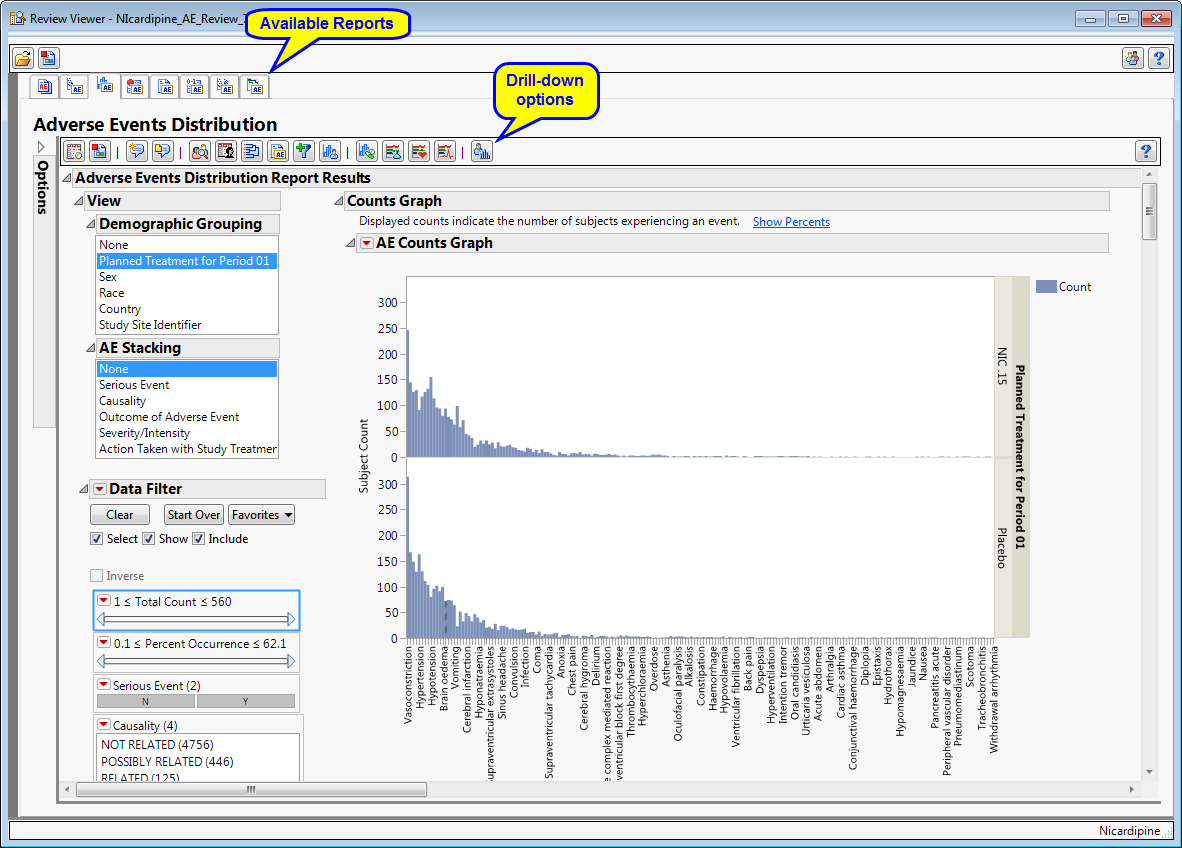
The
Review Viewer
enables you to interactively explore all of the reports in the saved
Review
. The
Data Filter
and all -down options for each report are available and fully functional. You can filter the observations and view subjects by demographic and other groupings. However, you cannot change. alter or update the initial options or conditions of any of the reports.
See
Available Reports
for a list and descriptions for all of the JMP Clinical reports.
Note
: Action buttons are active only when the requirements for their function are met.
Note
: By default, review templates are saved to
C:\Users\username\AppData\Roaming\SAS\JMPClinical\12\JMPC\ReviewTemplates
. If you want to save your templates elsewhere, simply navigate to the correct location before clicking
.
Note
: By default, review templates are saved to
C:\Users\username\AppData\Roaming\SAS\JMPClinical\12\JMPC\ReviewTemplates
and the
Open Review Template
window automatically opens to this folder. If your templates are located elsewhere, simply navigate to the correct location.