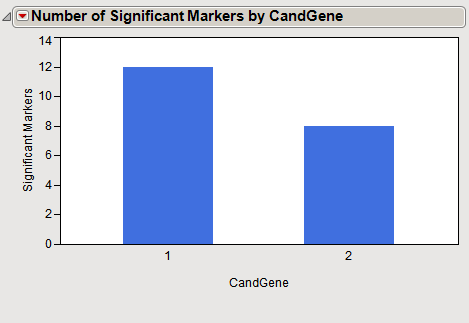
Bar Chart A bar chart is a graphical representation of discrete or non-continuous data. It consists of rectangular bars whose lengths are proportional to the magnitude of the values that they represent. Bar charts can be plotted either vertically ( left ) or horizontally ( right ).