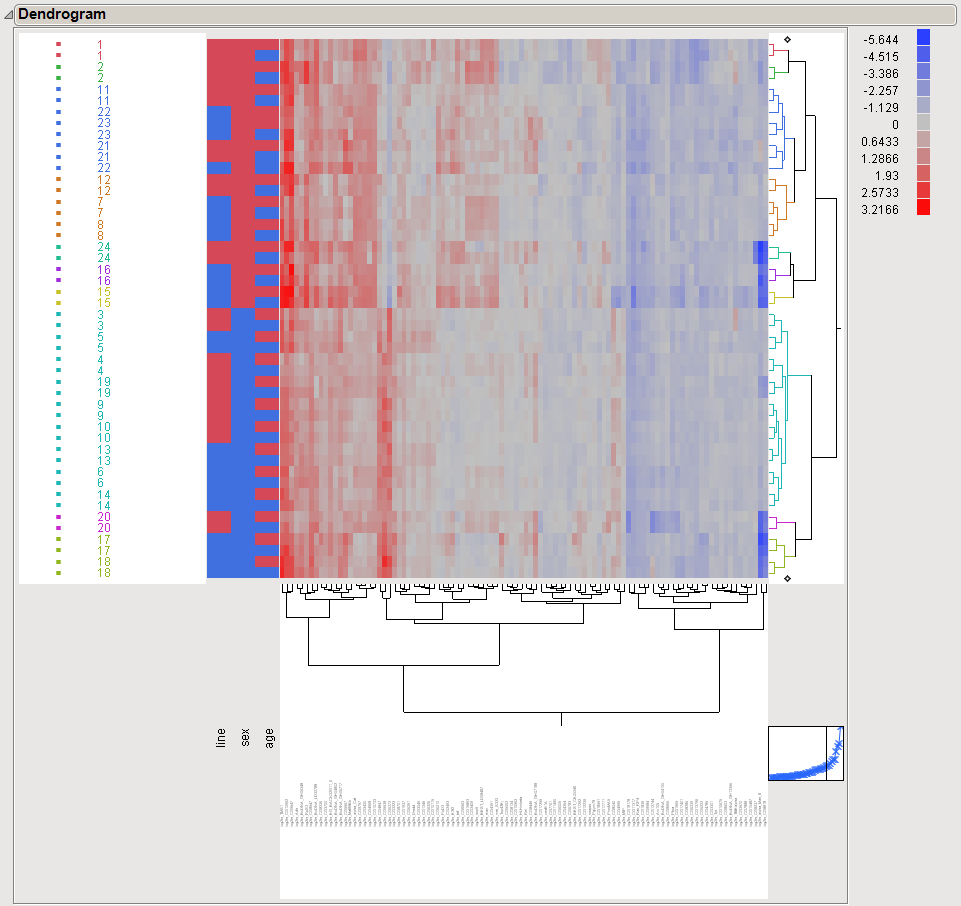
A heat map (shown below) is a two-dimensional graphical representation of data where the data values are mapped to colors across a range. The map below is produced by a
clustering
process that starts with each point in its own cluster. At each step, the two clusters that are closest together are combined into a single cluster. This process continues until there is only one cluster containing all the points. Values are close to each other relative to those of other clusters. The clustering process can be summarized in a
tree
-like diagram known as a
dendrogram
. A dendrogram shows where each cluster divides in a hierarchical fashion.