Report Output | Overviews | Standardized MedDRA Queries Incidence Screen

Standardized MedDRA Queries Incidence Screen
This report screens Standard MedDRA Query terms by performing a Cochran-Mantel-Haenszel exact test on all 2 x 2 tables constructed from event incidence and treatment arm. Output is a table of multiplicity-adjusted p-values, an accompanying volcano plot of relative risk and a SAS data set of indicator variables that can be used as input for other reports.
Running Standardized MedDRA Queries Incidence Screen for the Nicardipine study using MedDRA Version 16.0 files generates the report shown below. Refer to the Standardized MedDRA Queries Incidence Screen requirements description for more information. Your output might vary depending on which version of MedDRA you provide (in terms of the location of the *.asc files).
The Report contains the following elements:
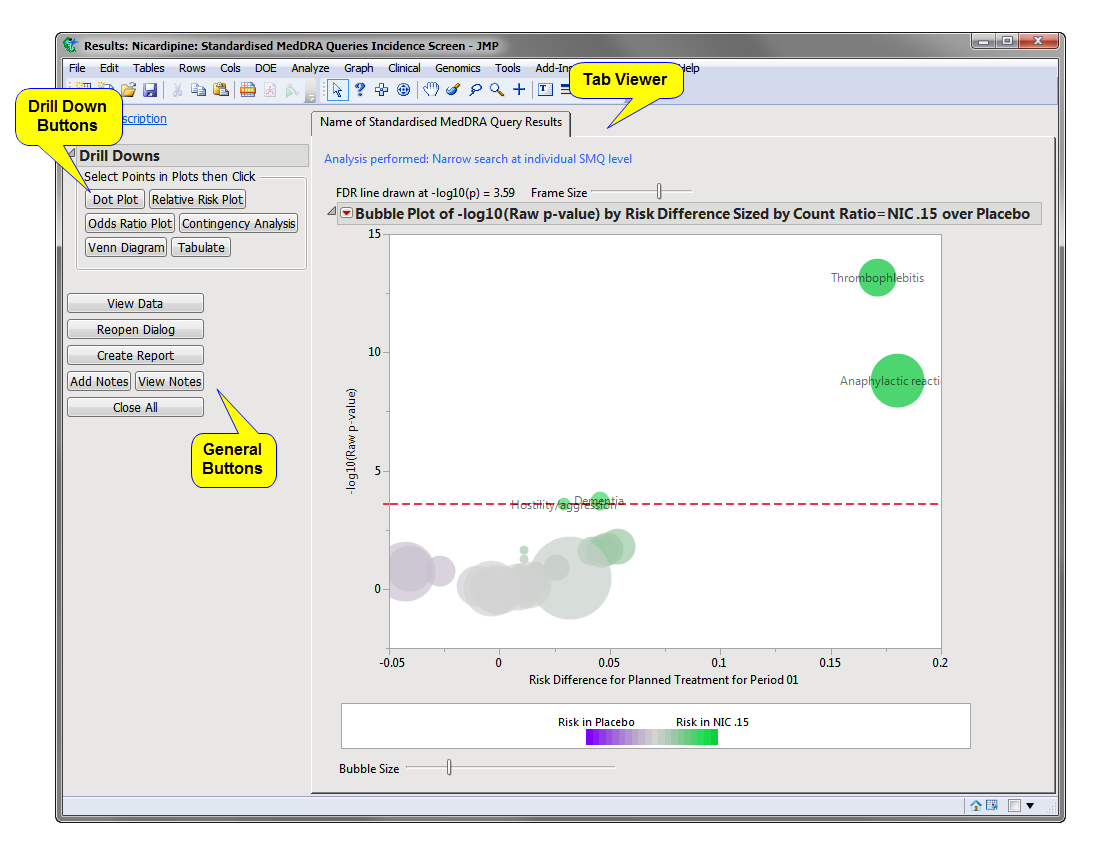
Name of Standardized MedDRA Queries Results: Provides one or more Volcano Plots to summarize the incidence of SMQs between pairs of treatments.
Down Buttons
down buttons provide you with an easy way to down into your data. The following down buttons are generated by this report:
Dot Plot: Click to create a dot plot for selected terms or for all terms that fall under selected groups, with rates of adverse events by treatment, the relative risk, the risk difference, and the odds ratio presented.
Relative Risk Plot: Click to create a relative risk plot and table for selected terms or for all terms that fall under selected groups, with rates of adverse events by treatment, the log2(relative risk) and unadjusted 95% confidence intervals (Multiple Testing Method is not applied) presented.
Odds Ratio Plot: Click to create a plot that shows the ratio of the odds for exhibiting a selected event/intervention to the odds for those who do not exhibit the event/intervention and it can be used to estimate the relative risk when the probability of positive response is small.
Contingency Analysis: Click to create the typical treatment by event contingency table for selected terms or for all terms that fall under selected groups.
Venn Diagram: Click to create a Venn diagram for up to five selected terms or for terms that fall under selected groups, to show the co-occurrence of adverse events within study subject.
Tabulate: Click to create a table for selected terms or for all terms that fall under selected groups, showing the co-occurrence of adverse events within study subject. You can further modify the tables to show additional summary statistics.
General
Click to generate a standardized pdf- or rtf-formatted report containing the plots and charts of selected sections.
Click to read user-generated notes. Refer to View Notes for more information.
Click the Options arrow to reopen the completed report dialog used to generate this output.
Click the gray border to the left of the Options tab to open a dynamic report navigator that lists all of the reports in the review. Refer to Report Navigator for more information.