This report screens all findings measurements for a specified domain one at a time by performing a repeated-measures analysis of variance. The baseline measurements can be considered as a covariate or as a response. A measurement is determined to be a baseline measurement by the xxBLFL variable where xx is substituted with the 2-letter code for the chosen domain for analysis. If this variable does not exist, baseline is calculated from measurements taken on or before day 1 of the study. A time window can be specified to determine baseline measurements. A compound symmetry covariance structure is assumed within each subject. A separate model is fit for each lab measurement. You can also separate the data into time windows. A volcano plot of the interaction effect and other output enable efficient screening of lab scores that differ between treatment groups.
Refer to the Findings ANOVA requirements description for more information.
Note: JMP Clinical uses a special protocol for data including non-unique Findings test names. Refer to How does JMP Clinical handle non-unique Findings test names? for more information.
Running this report for Nicardipine using default settings generates the tabbed Report window shown below. Results organized in sections. Each sections contains one or more plots, data panels, data filters, or other elements that facilitate your analysis.
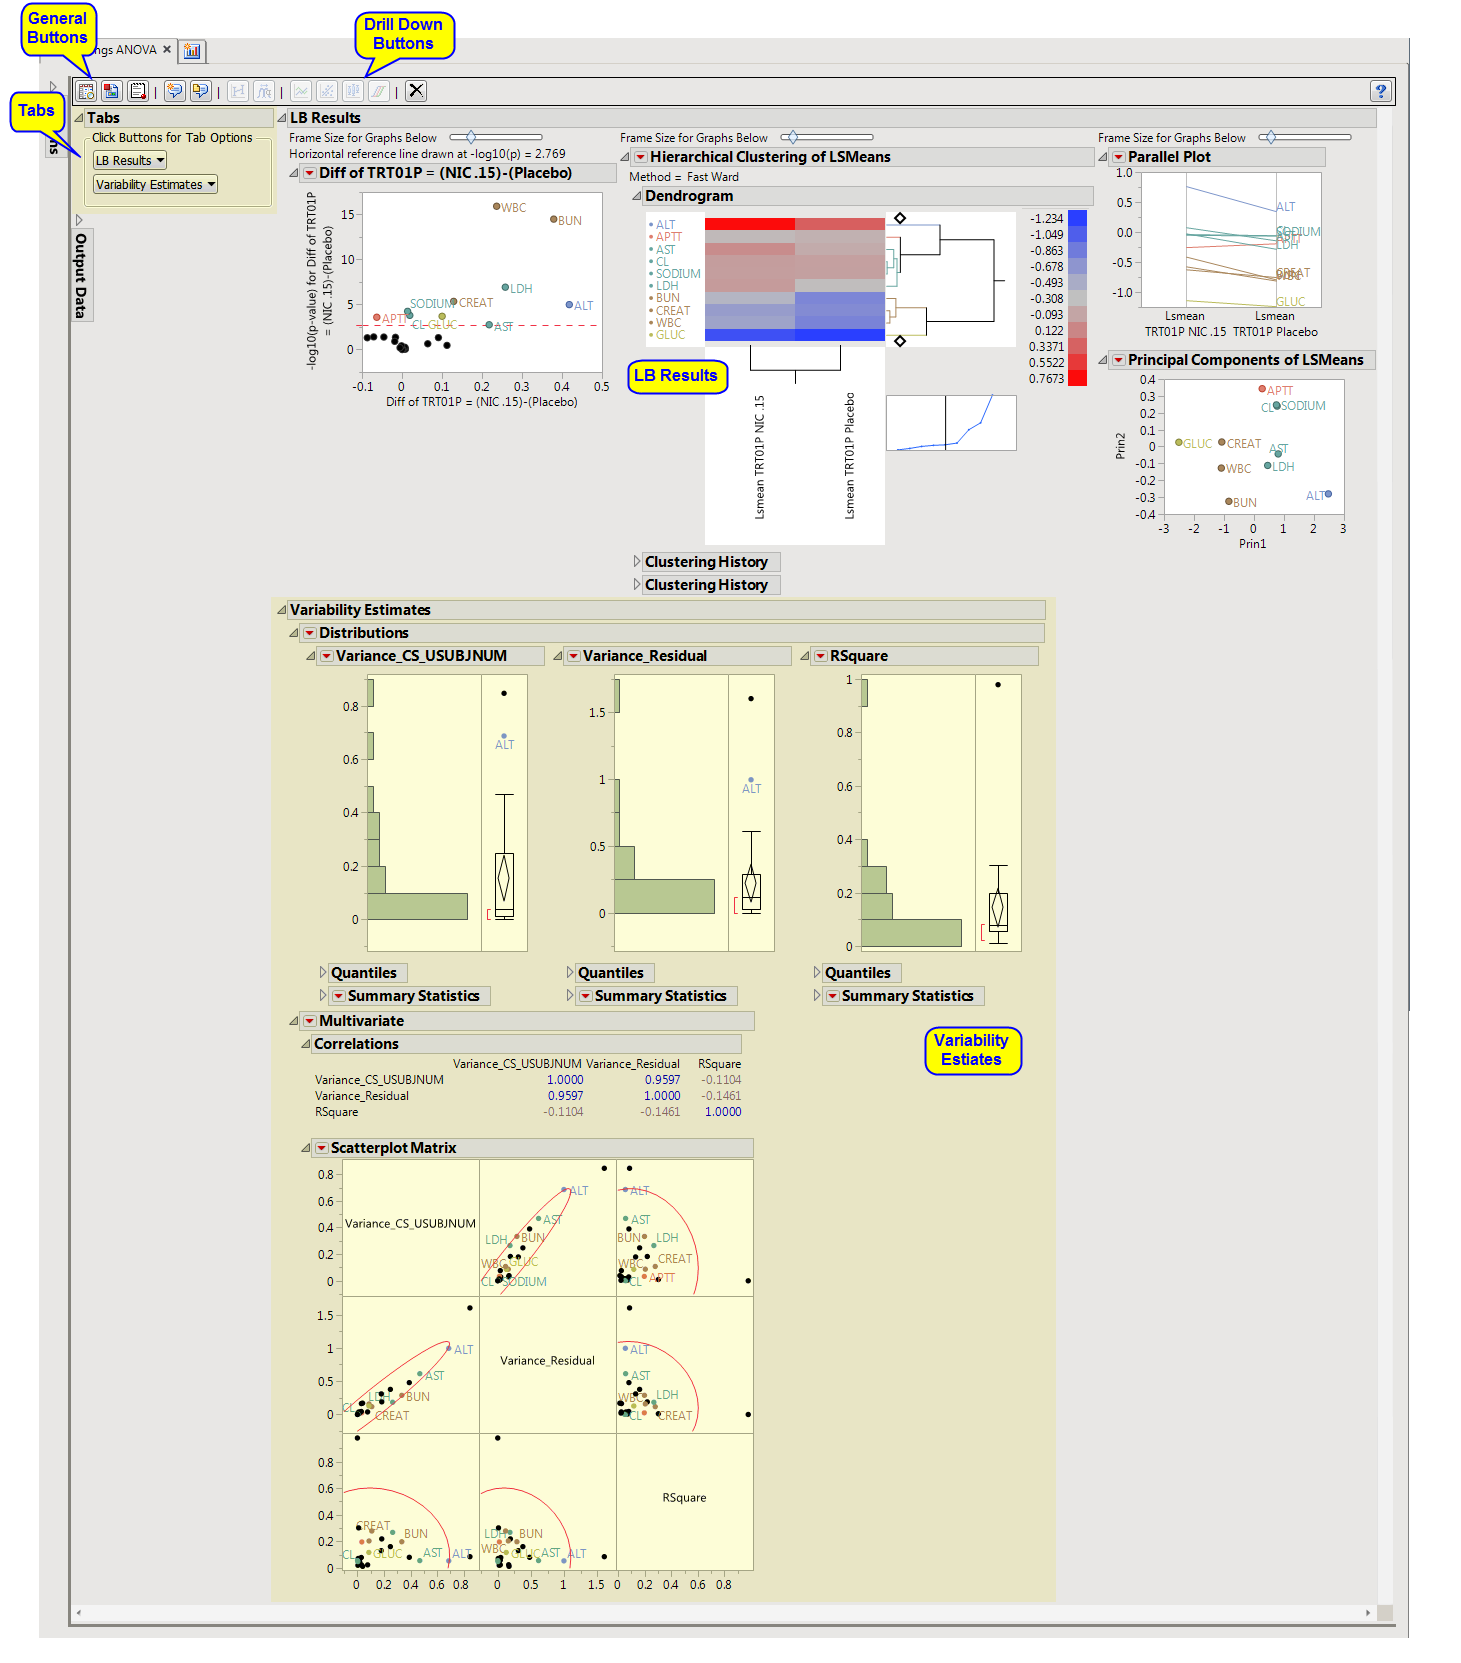
The Results window contains the following panes:
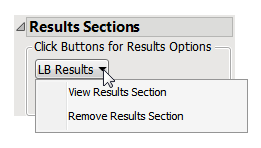
This pane enables you to access and view the output plots and associated data sets on each tab. Use the drop-down menu to view the section in the Results pane or remove the section and its contents from the Results pane.
|
•
|
LB Results: This tab shows the primary results from the analysis, including Volcano Plots and various analyses on least squares means.
|
|
•
|
Variability Estimates: This tab shows the analyses on variance component estimates from the ANOVA model fits.
|
|
•
|
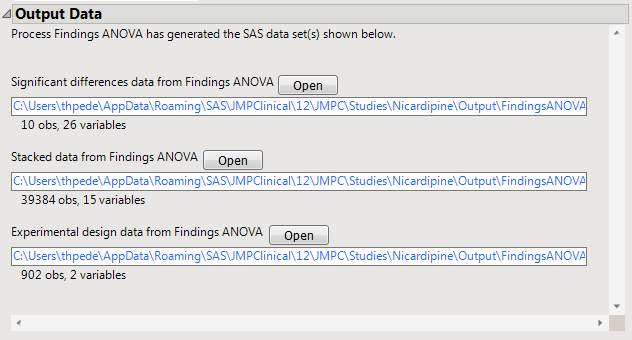
Significant Differences Data Set: This output data set contains a complete list of the Findings tests significant by one or more criteria. This data set is indicated by the _sig suffix. Click to view the data set.
|
|
•
|
Stacked Data Set: Contains findings measurements at subject level in a stacked format. Click to view the data set.
|
|
•
|
Experimental Design Data Set: This is a SAS data set that provides information about the columns of a tall data set. It describes relevant experimental variables such as treatment conditions and covariates as well as a variable named ColumnName. Refer to The Example Data for more information. Click to view the data set.
|
|
•
|
Fit Model and Plot LS Means: Select points or rows and click
|
|
•
|
Construct One-way Plots: Click
|
|
•
|
Trend Plots: Select Findings tests of interest and click
|
|
•
|
Shift Plot: Select Findings tests of interest and click
|
|
•
|
Box Plot: Select Findings tests of interest and click
|
|
•
|
Waterfall Plot: Click
|
|
•
|
Click
|
|
•
|
Click
|
|
•
|
Click
|
|
•
|
Click
|
|
•
|
Click the arrow to reopen the completed report dialog used to generate this output.
|
|
•
|
Click the gray border to the left of the Options tab to open a dynamic report navigator that lists all of the reports in the review. Refer to Report Navigator for more information.
|