This report displays shift plots to compare test measurements for a specified findings domain at baseline versus on-therapy values and performs a matched pairs analysis on average score during baseline and a summary score during the trial. A separate analysis is done for each findings measurement.
Refer to the Findings Shift Plots requirements description for more information.
Note: JMP Clinical uses a special protocol for data including non-unique Findings test names. Refer to How does JMP Clinical handle non-unique Findings test names? for more information.
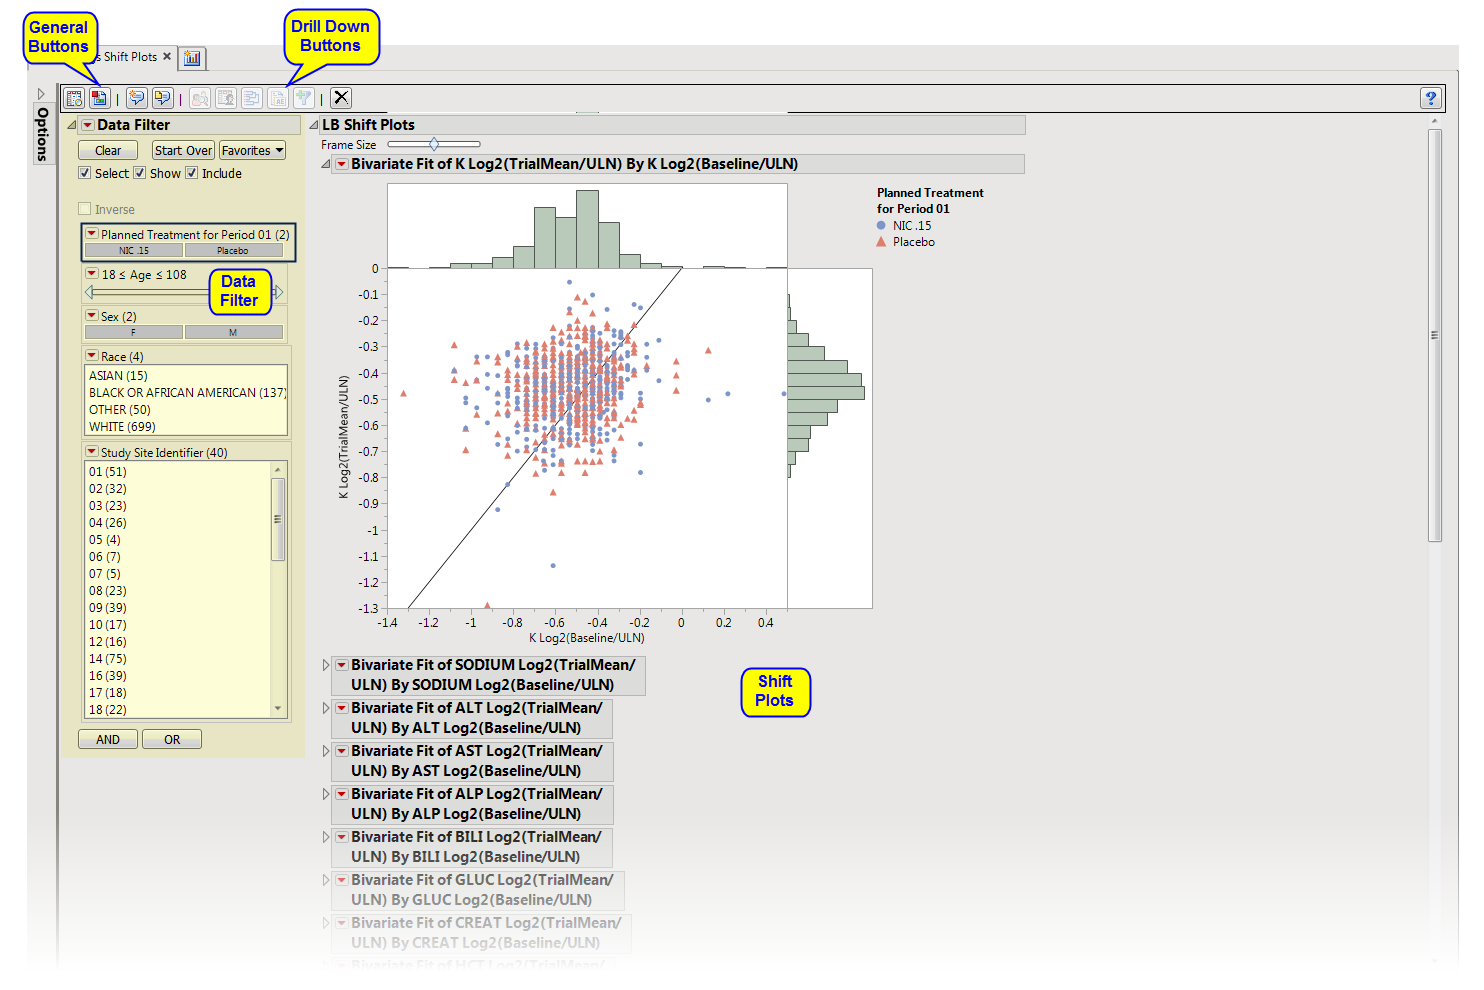
Running Findings Shift Plots for Nicardipine using default settings generates the report shown below.
The Report contains the following elements:
|
•
|
|
•
|
LB Shift Tables: Contains crosstabulation tables comparing baseline and trial statistic elevation measurements for each laboratory test. Note: This section is generated only if the Display cross-tabulation tables of Baseline versus Trial laboratory measurement elevations box is checked on the report dialog.
|
|
•
|
LB Matched Pairs: Compares experimental groups for each finding through the use of Matched Pairs Analysis plots.
|
This enables you to subset subjects based on demographic characteristics and study site. Refer to Data Filter for more information.
|
•
|
Profile Subjects: Select subjects and click
|
|
•
|
Show Subjects: Select subjects and click
|
|
•
|
Cluster Subjects: Select subjects and click
|
|
•
|
AE Narrative: Select subjects and click
|
|
•
|
Demographic Counts: Select subjects and click
|
|
•
|
Click
|
|
•
|
Click
|
|
•
|
Click
|
|
•
|
Click
|
|
•
|
Click the arrow to reopen the completed dialog used to generate this output.
|
|
•
|
Click the gray border to the left of the Options tab to open a dynamic report navigator that lists all of the reports in the review. Refer to Report Navigator for more information.
|