This report enables you to visualize findings measurements across the time line of the study. Refer to the Findings Time Trends requirements description for more information.
Note: JMP Clinical uses a special protocol for data including non-unique Findings test names. Refer to How does JMP Clinical handle non-unique Findings test names? for more information.
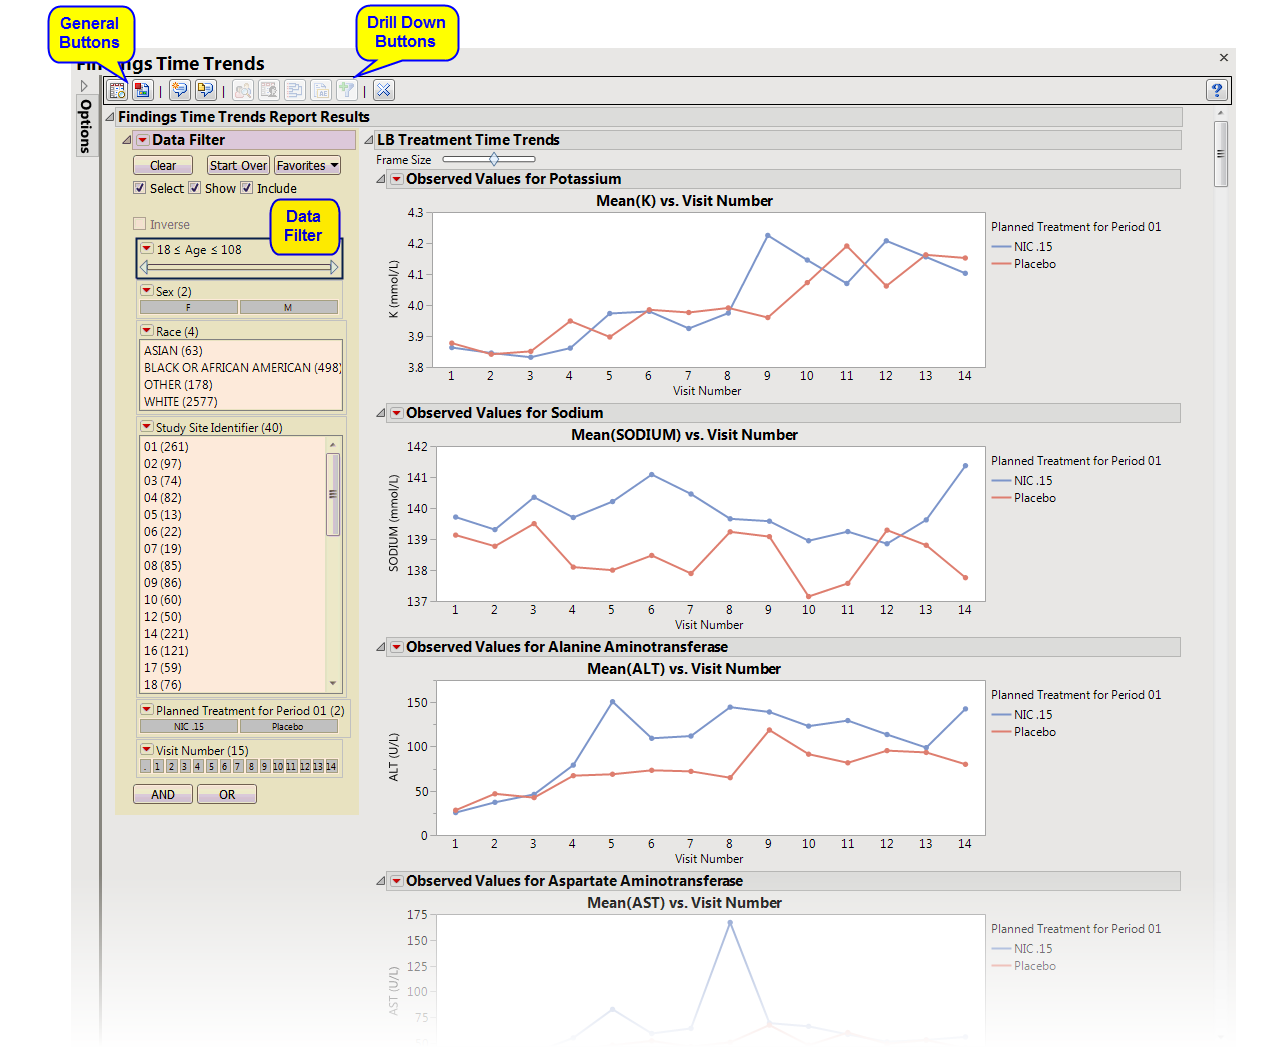
Running Findings Time Trends with the Nicardipine sample setting and LB findings domain generates the report shown below.
The Report window contains the following sections:
|
•
|
Treatment Time Trends: This section shows a plot for each quantitative findings test (for example, laboratory) in the Findings data set that was analyzed. Each plot contains a line for each treatment group representing the average measurements taken across time.
|
|
•
|
Subject Time Trends: This section shows a plot for each quantitative findings test (for example, laboratory) in the Findings data set that was analyzed. Each plot contains a line for each subject in the study representing the patient's measurements taken across time.
|
This enables you to subset subjects based on demographic characteristics and other factors. Refer to Data Filter for more information.
|
•
|
Profile Subjects: Select subjects and click
|
|
•
|
Show Subjects: Select subjects and click
|
|
•
|
Cluster Subjects: Select subjects and click
|
|
•
|
Demographic Counts: Select subjects and click
|
|
•
|
Click
|
|
•
|
Click
|
|
•
|
Click
|
|
•
|
Click
|
|
•
|
Click the arrow to reopen the completed report dialog used to generate this output.
|
|
•
|
Click the gray border to the left of the Options tab to open a dynamic report navigator that lists all of the reports in the review. Refer to Report Navigator for more information.
|