Note: JMP Clinical uses a special protocol for data including non-unique Findings test names. Refer to How does JMP Clinical handle non-unique Findings test names? for more information.
Running this report with the Nicardipine sample setting generates the report shown below.
The Report contains the following elements:
|
•
|
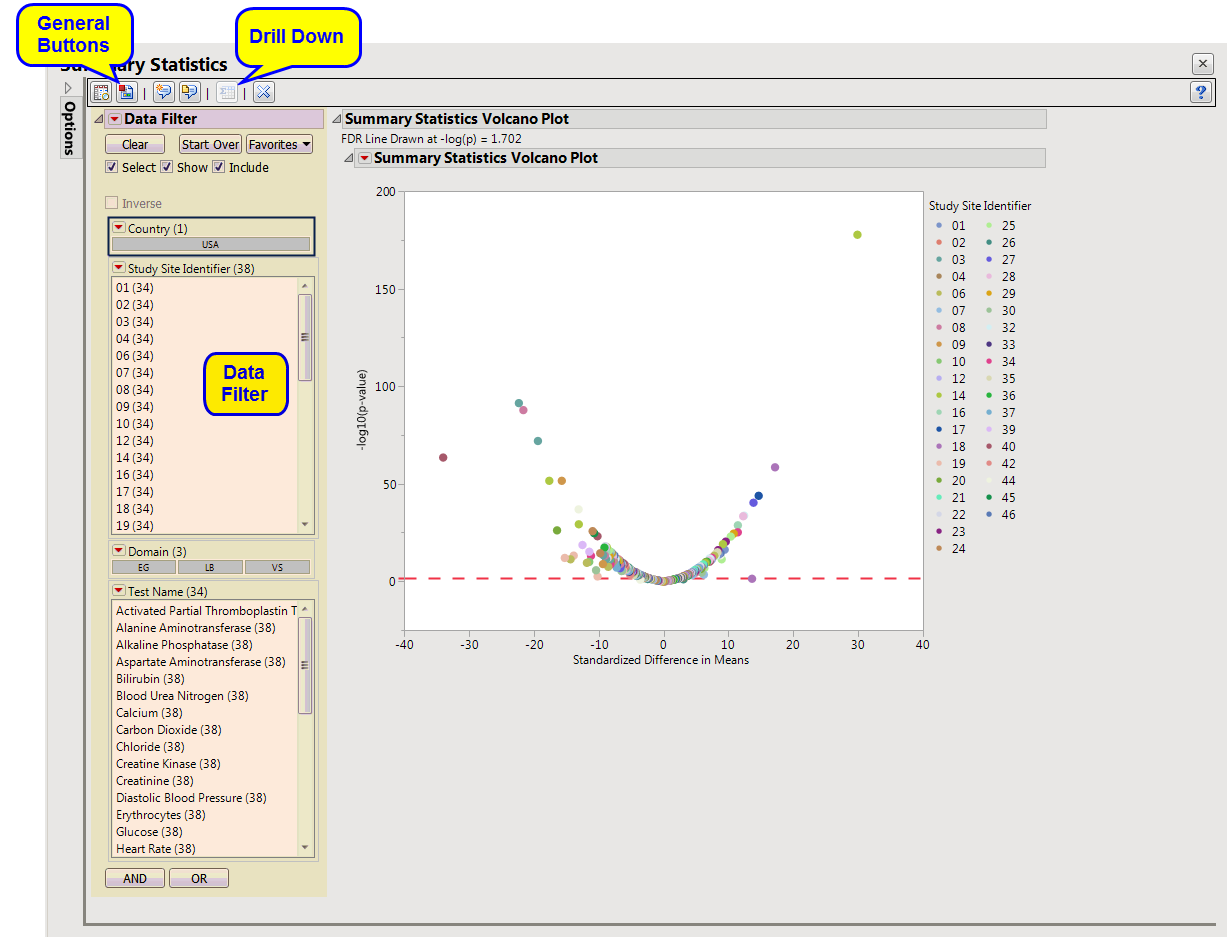
Summary Statistics Volcano Plot: Shows a volcano plot used to determine the deviation of a mean or variance for Findings tests at a site versus other sites. Each point represents a single Findings test for a specific site. Here, the x-axis represents the standardized difference in means between each between the site and the reference set (all other sites). For comparisons of variances, the x-axis represents the log2(Ratio of Variances) between the site and the reference set.
|
|
•
|
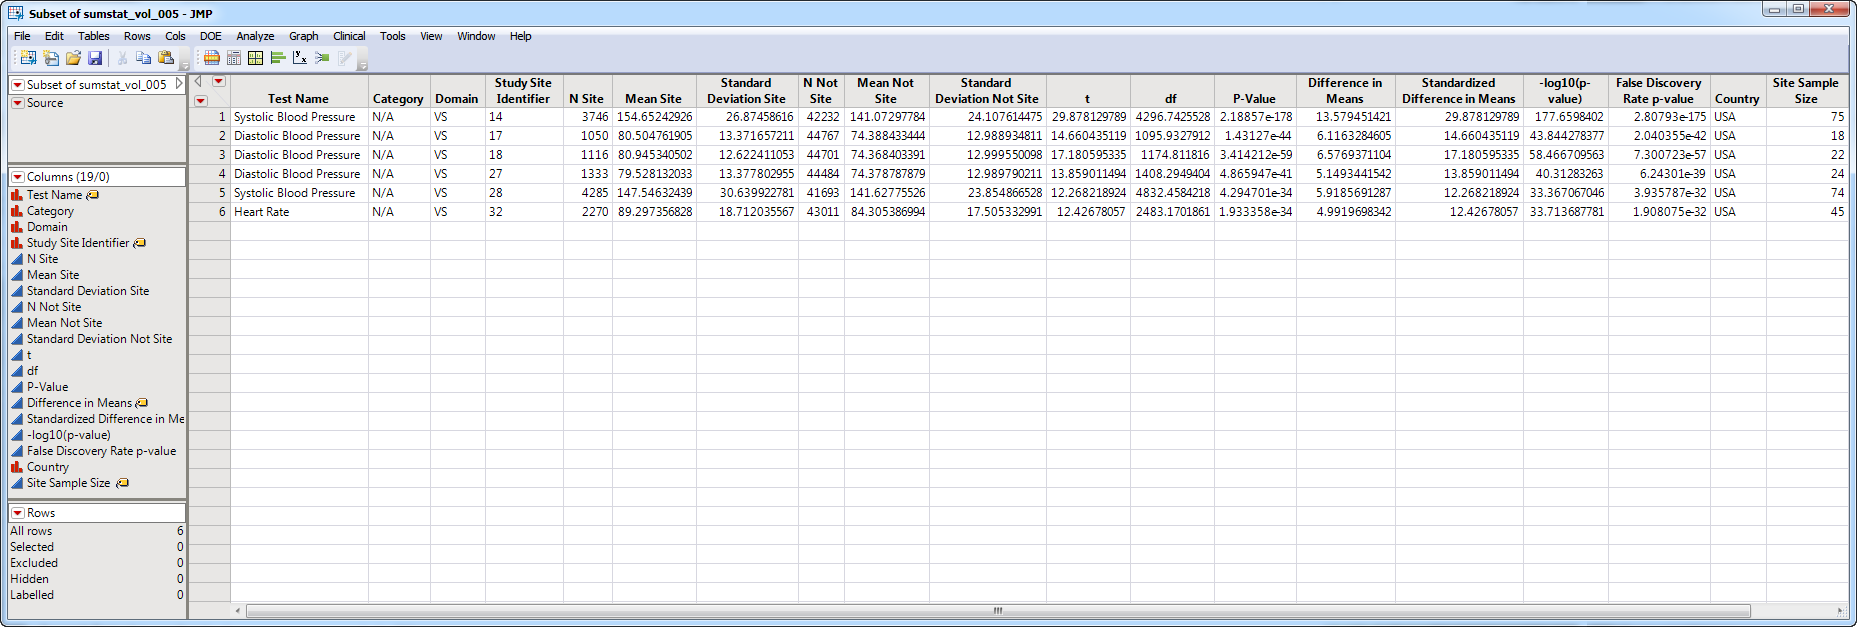
Show Summary Statistics: Shows the rows of the data table for the selected points from the volcano plot. Clicking
|
|
•
|
Click
|
|
•
|
Click
|
|
•
|
Click
|
|
•
|
Click
|
|
•
|
Click the arrow to reopen the completed report dialog used to generate this output.
|
|
•
|
Click the gray border to the left of the Options tab to open a dynamic report navigator that lists all of the reports in the review. Refer to Report Navigator for more information.
|
|
•
|
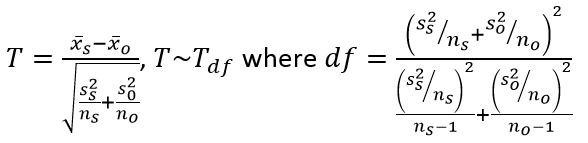
Mean - An unpaired t-test assuming unequal variances between the groups is used.
|
FDR p-values are calculated and the reference line is determined as described in How does JMP Clinical calculate the False Discovery Rate (FDR)?.
|
•
|
Variance - A test of unequal variance is
|
|
•
|
Skewness and Kurtosis - No statistical tests are performed.
|