The Report contains the following elements:
|
•
|
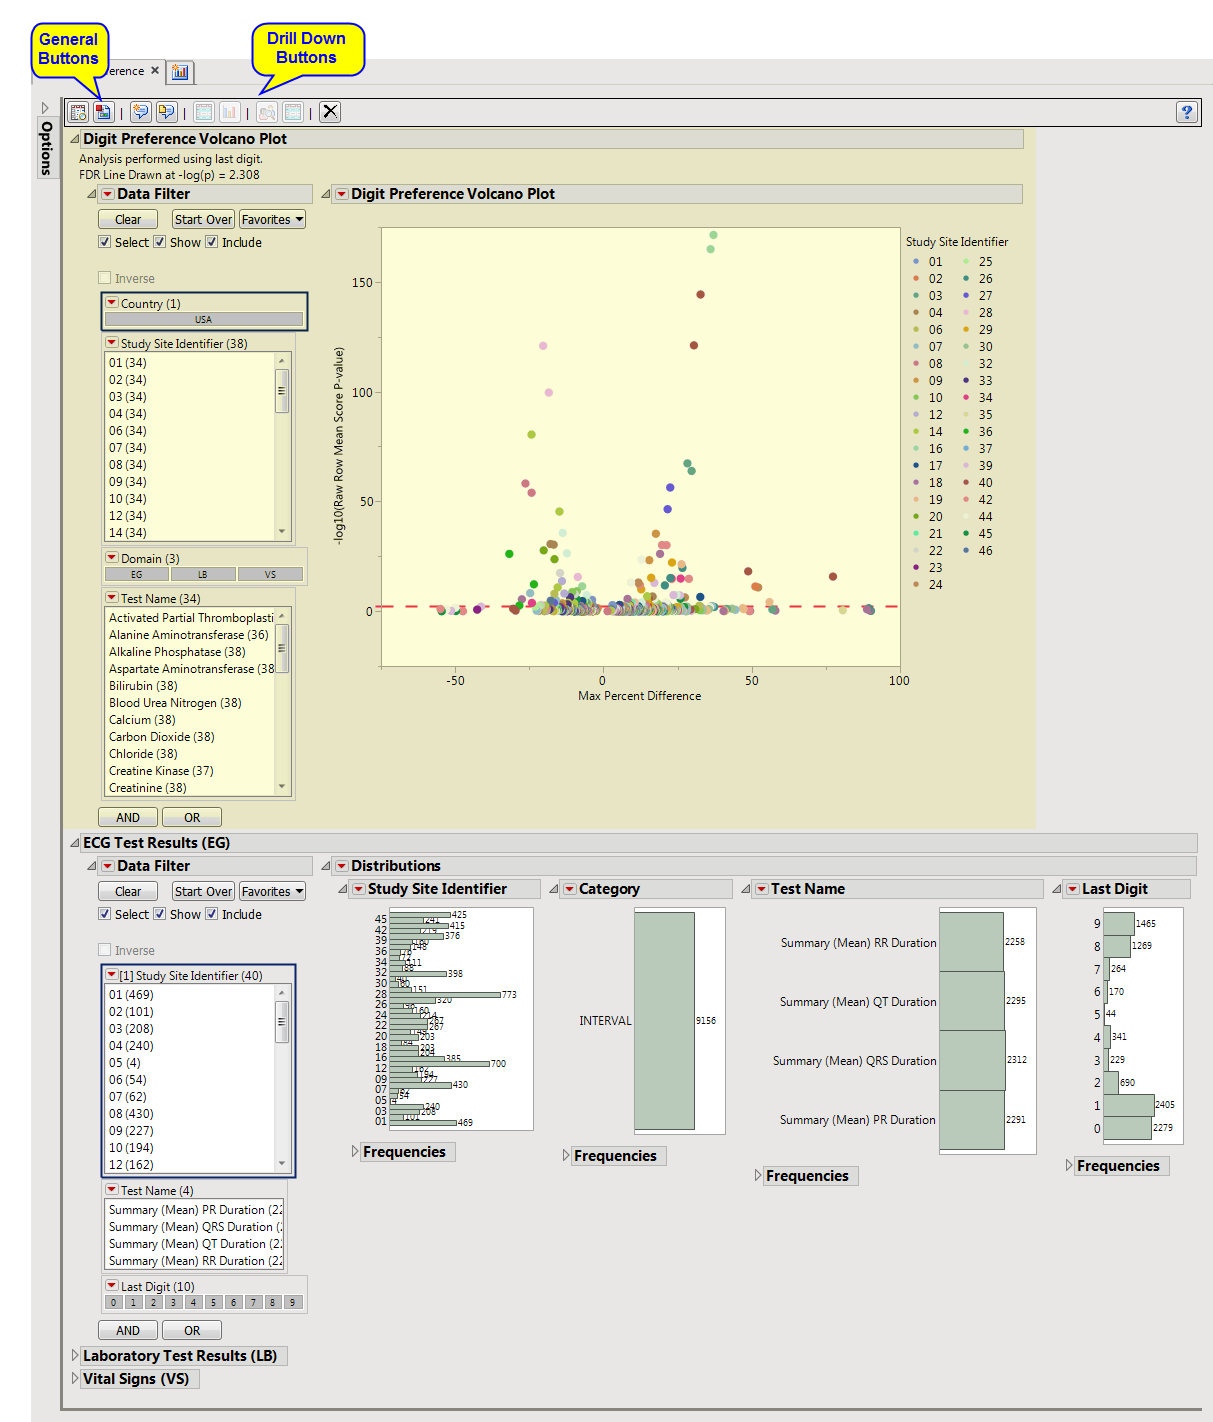
Digit Preference Volcano Plot: Each point represents the comparison of a site to all other sites. This comparison is used to determine whether there is a difference in distribution for the last digit for a findings test with numeric data available and is done for all sites across all tests in all findings domains.
|
The y-axis is the -log10(Raw Row Mean Score p-value), which takes advantage of the ordinality of the final digit value, This test uses standardized midrank scores in case there are gaps due to certain digit values not present. Midranks are a way of scoring the columns when the distance between levels does not necessarily have a practical interpretation. Large numbers on the y-axis indicate statistically significant results.
Values far from 0 indicate important differences between a site and the reference distribution of all other sites. An FDR (alpha=0.05) line is indicated by the dotted red line. Values above this line can be considered significant adjusting for multiple comparisons. This could identify rounding issues or other problems with how a site reports a particular test compared to other sites.
|
•
|
Test Results (Digit Preference): One or more sections displaying distributions for subjects’ tests across study sites. There is a separate set of distributions for each Findings domain.
|
|
•
|
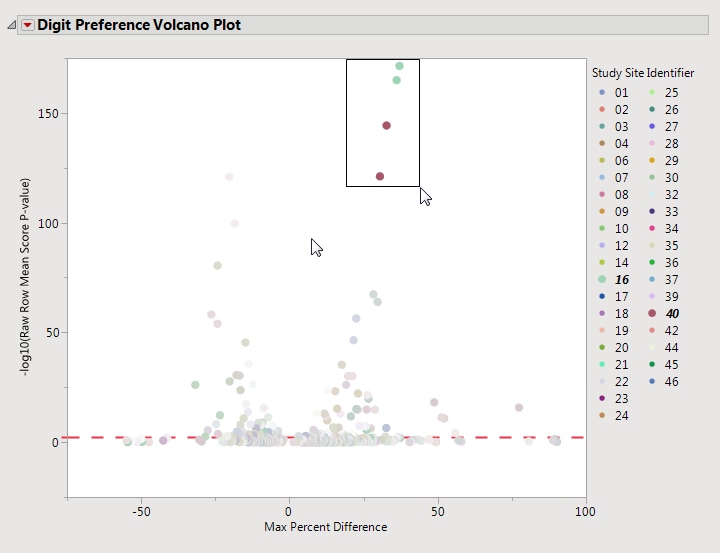
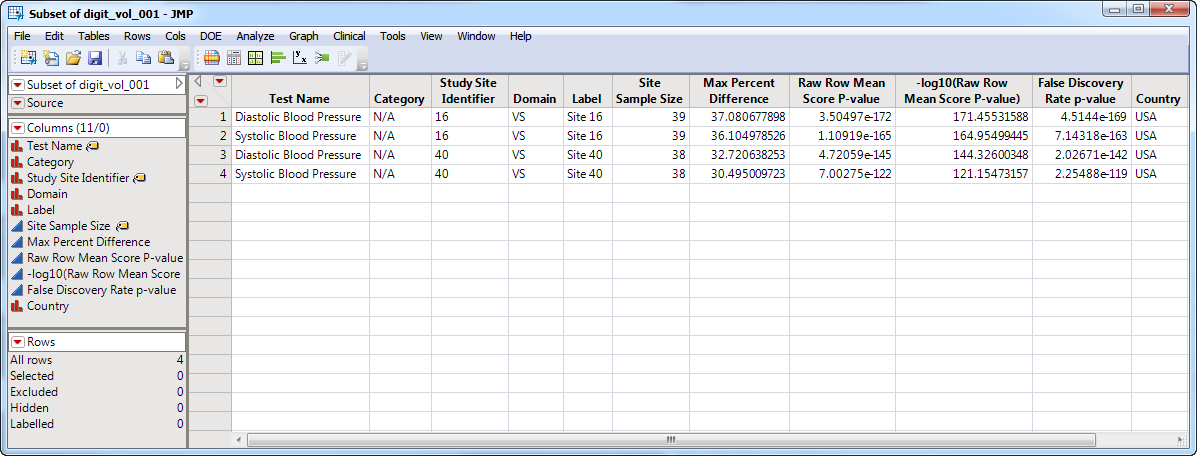
Show Sites: Shows the rows of the data table for the selected points from the volcano plot. Use your mouse to select one or more sites of interest before clicking this button, as shown below:
|
|
•
|
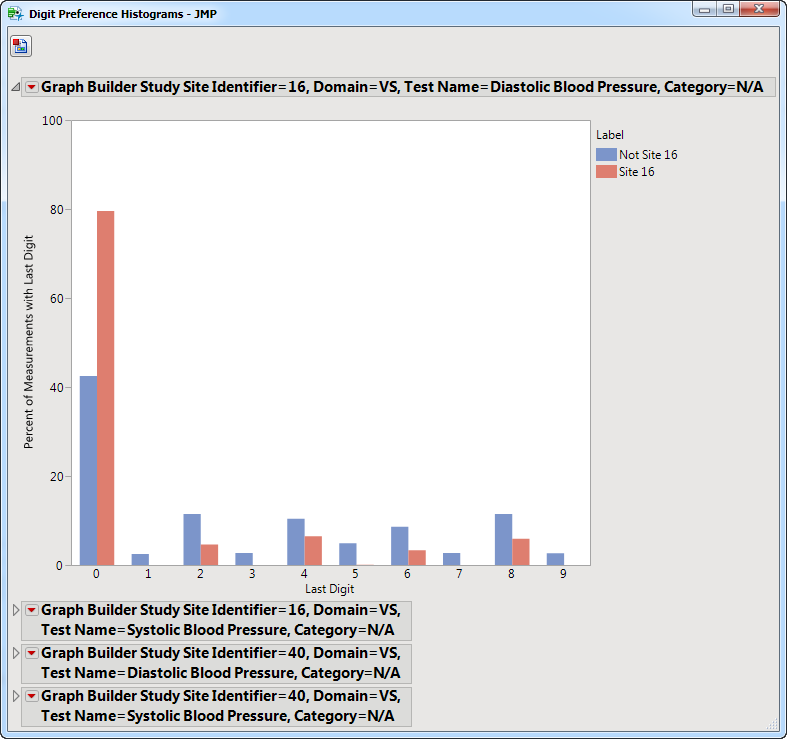
Digit Bar Charts: Clicking
|
|
•
|
Click
|
|
•
|
Click
|
|
•
|
Click
|
|
•
|
Click
|
|
•
|
Click the arrow to reopen the completed report dialog used to generate this output.
|
|
•
|
Click the gray border to the left of the Options tab to open a dynamic report navigator that lists all of the reports in the review. Refer to Report Navigator for more information.
|
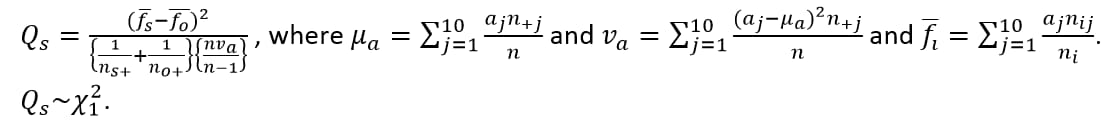
Compare the observed distribution of the last or first digit for each test with each site (the suspect site, indexed with s) compared to all other sites taken together as a reference (indexed as o).
Compared using a row mean score chi-square tests (Stokes et al., 2012)2 to take advantage of the ordinality of the column variable.
FDR p-values are calculated and the reference line is determined as described in How does JMP Clinical calculate the False Discovery Rate (FDR)?.
This is the maximum of (p(0 in suspect) - p(0 in reference), p(1 in suspect) - p(1 in reference), … p(9 in suspect) - p(9 in reference)) where p(x) is the percent of records, suspect is the site in question and reference is all other sites that are not the site in question.