The DM Distribution report displays the Demographic characteristics for a clinical study. It accomplishes this using both a graphical histogram display (Demographic Details) and a tabular display (Demographic Tables). Optionally, but not by default, it can display statistical comparisons as well.
Running this report with the Nicardipine sample setting using the default options generates the output shown below.
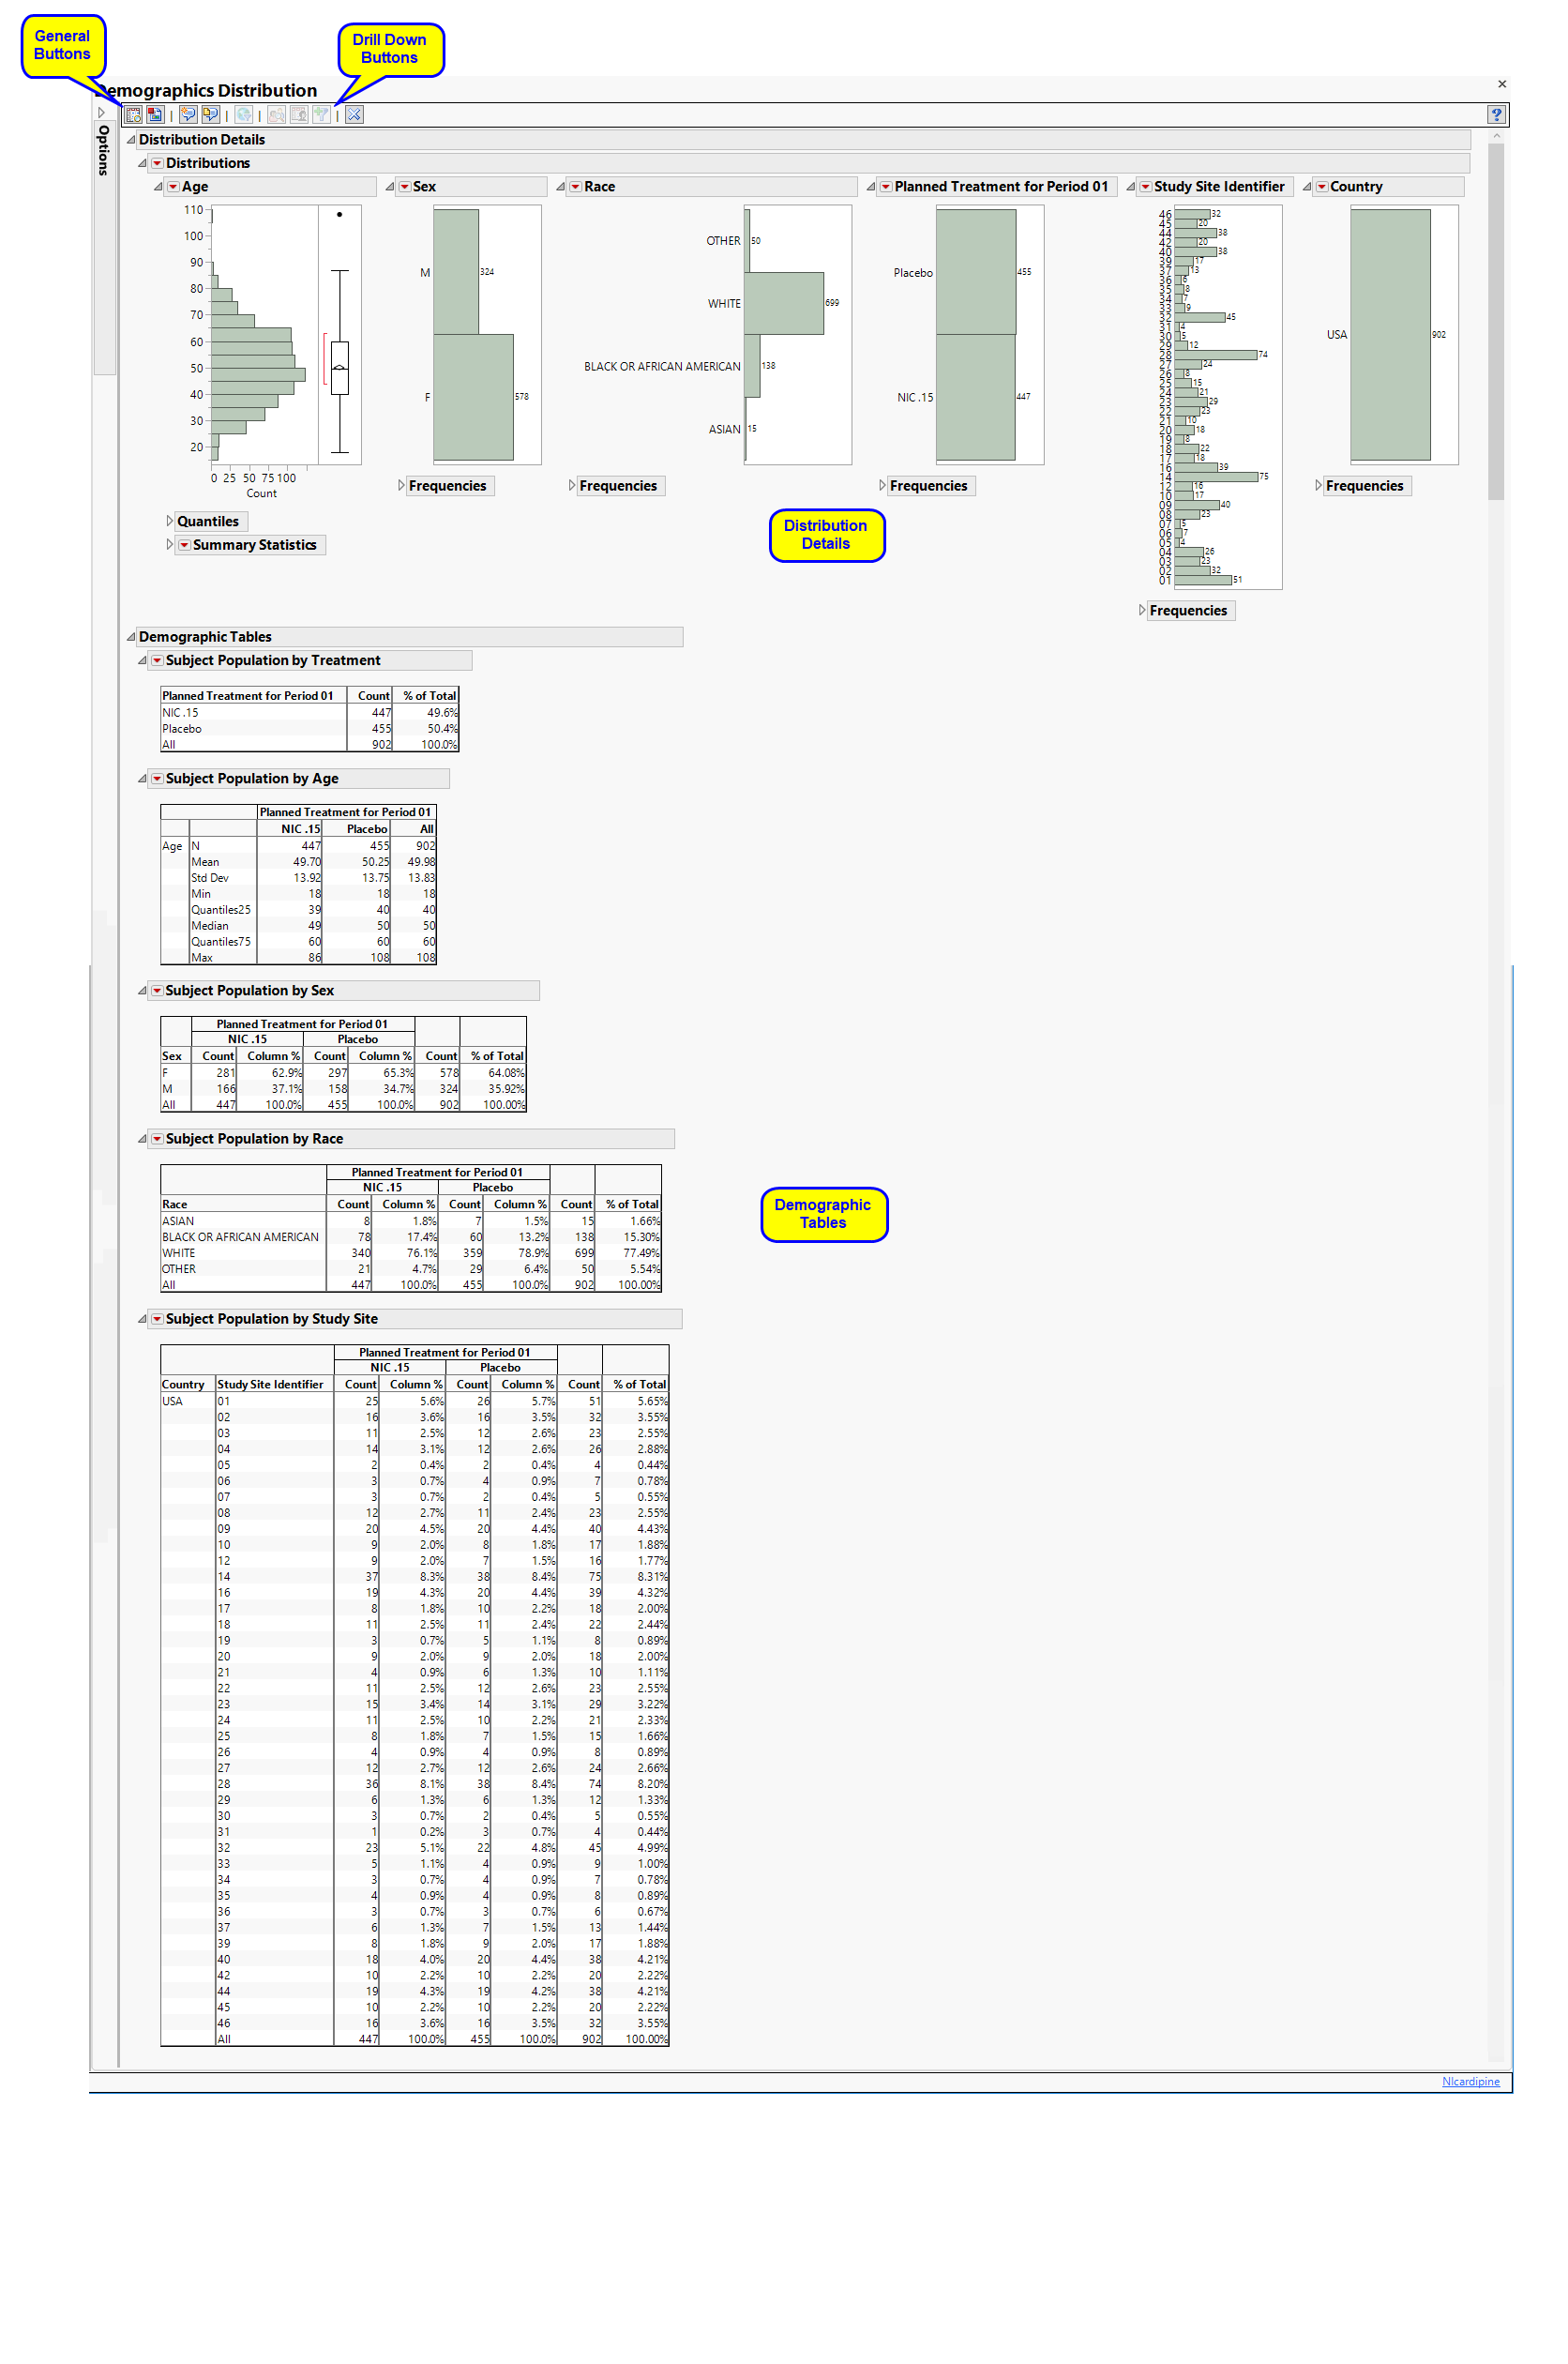
The DM Distribution report initially shows two sections Distribution Details and Demographic Tables. Use the available options in each section to drill-down into the data.
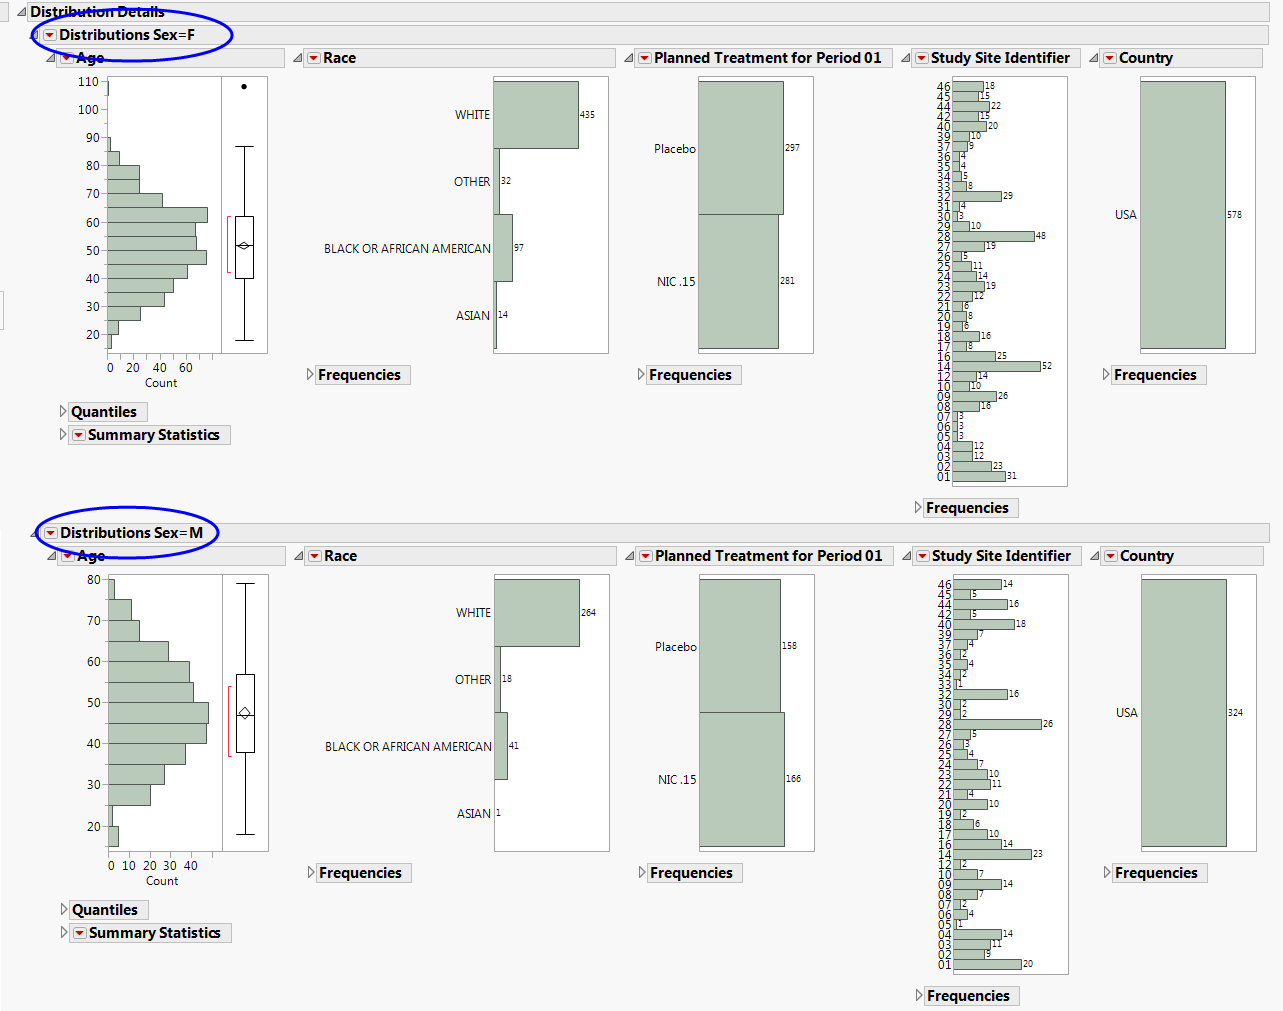
Presents histograms for available demographic characteristics such as age, treatment, sex, race, ethnicity. Histograms of the, Study Site Identifier and Country are also presented. Should more than one Country be presented in the DM domain, a world map is presented with color indicating the count of subjects from each Country. See JMP Documentation on Distribution for more information.
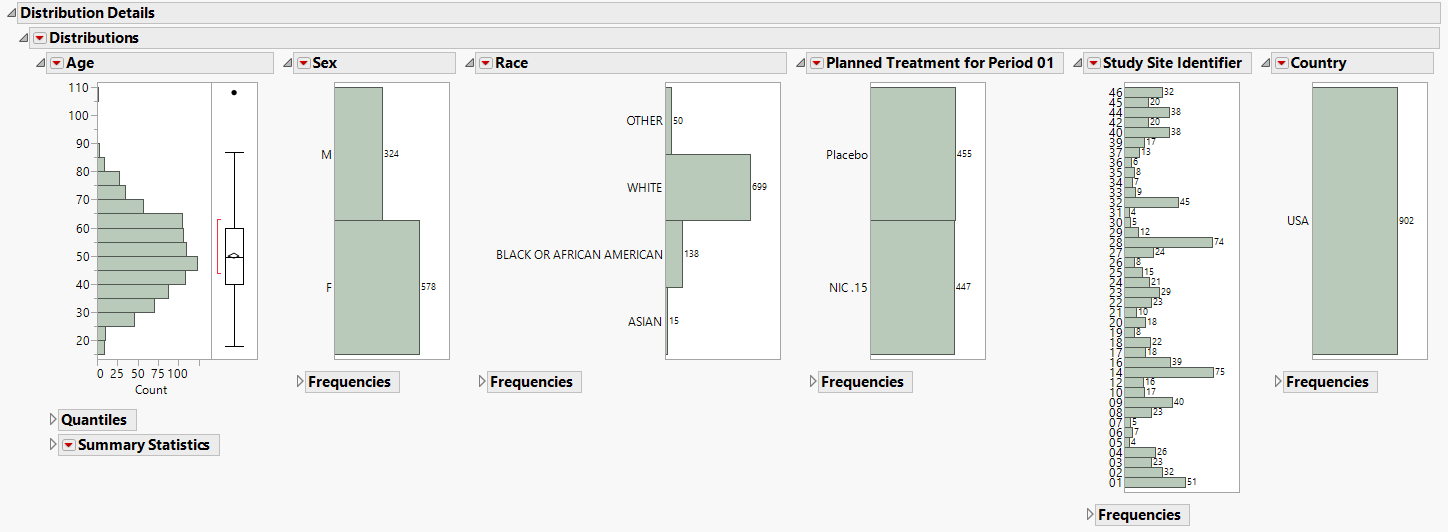
The Distribution Details section contains the following elements:
|
•
|
The height (or length) of each bar is an indication of the number of subjects exhibiting each demographic characteristic. Numbers above (or to the right of) each bar reflect a count of the number of subjects. Counts or percents can be added or removed using Histogram Options, which can be viewed by selecting the red triangle ( ).
).
Quantiles and summary statistics are provided for continuous variables like Age, and frequencies are provided for categorical variables like Sex. These can be viewed by clicking the triangles ( ).
).
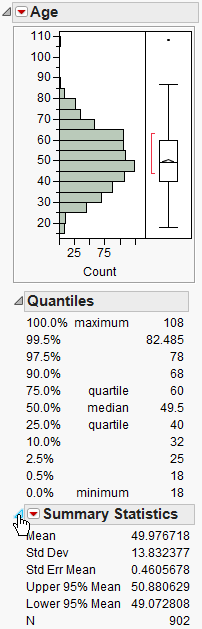
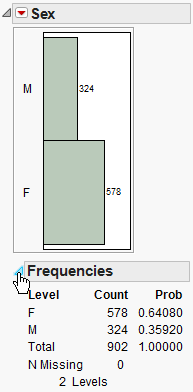
See Distribution for more information.
|
•
|
In lieu of a histogram, should Country have more than one level, a map summarizes the geographic location of individuals. Color is reflective of the number of subjects from each Country.
See maps for more information.
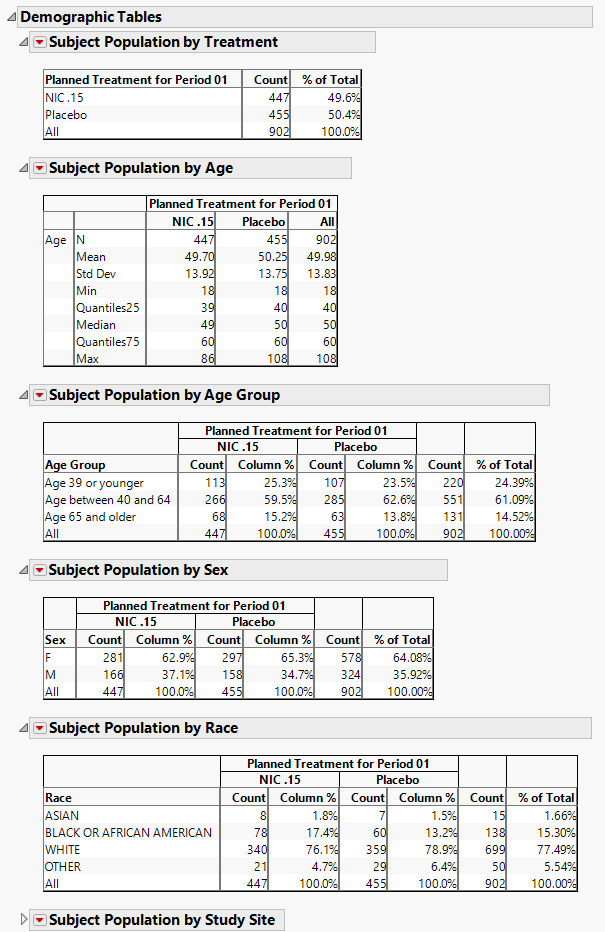
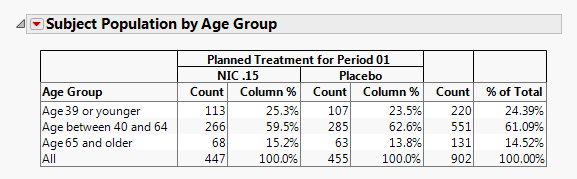
The Demographic Tables section contains the following elements:
|
•
|
|
•
|
Profile Subjects: Select subjects and click
|
|
•
|
Show Subjects: Select subjects and click
|
|
•
|
Demographic Counts: Select subjects and click
|
|
•
|
Click
|
|
•
|
Click
|
|
•
|
Click
|
|
•
|
Click
|
|
•
|
Click the arrow to reopen the completed report dialog used to generate this output.
|
|
•
|
Click the gray border to the left of the Options tab to open a dynamic report navigator that lists all of the reports in the review. Refer to Report Navigator for more information.
|
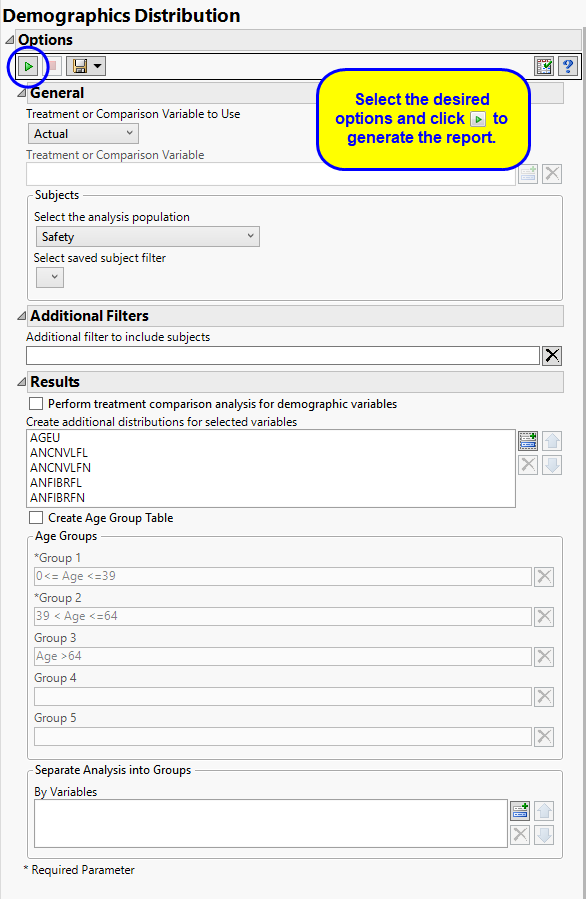
Available variables include Planned, which is selected when the treatments patients received exactly match what was planned and Actual, which is selected when treatment deviates from what was planned. You can also specify any demographic variable from DM and/or ADSL as a surrogate for the treatment variables. Finally you can select None to plot the data without segregating it by a treatment variable.
You can also subdivide the subjects and run separate analyses for distinct groups by specifying one or more BY variables. For example, selecting SEX as a BY variable groups subjects by gender and conducts separate gender-specific analyses, as shown below:
See Select the analysis population, Select saved subject Filter1, Additional Filter to Include Subjects, Subset of Visits to Analyze for Findings, and By Variables for more information.
When the Perform treatment comparison analysis for demographic variables option is checked, this report performs aone-way ANOVA (analysis of variance) to detect statistical differences using the Treatment or Comparison Variable specified for continuous demographic variables (e.g. Age) and contingency analyses for character/categorical variables (e.g. sex, race). If the Treatment or Comparison Variable is set to None, this option is ignored.
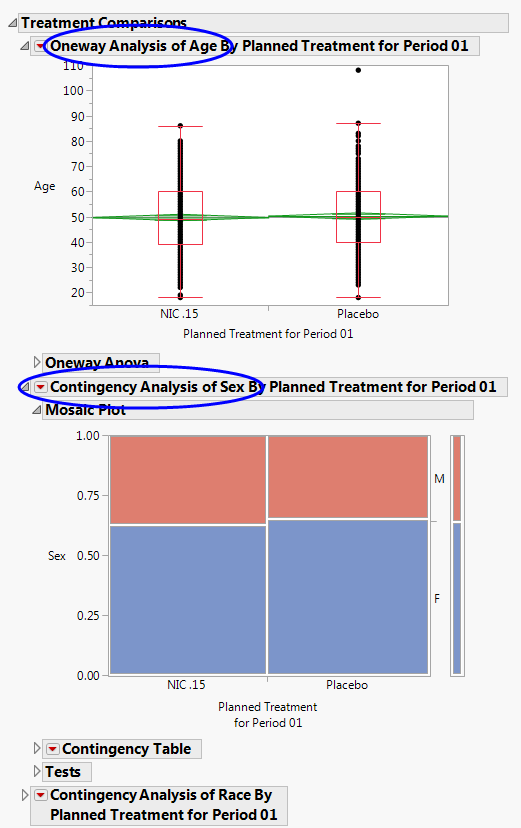
See Perform treatment comparison analysis for demographic variables for more information.
Use the Create additional distributions for selected variables to select additional variables for which to show distribution details. When variables are selected that are not already shown by default, a new Distribution section called Additional Distributions is generated in the output for these customized distributions.
Note: You must specify non-overlapping exclusive age groups.
Note: Any subjects not falling within the specified age groups are still included in the analysis but are classified as Missing in the demographic tables.
You can also subdivide the subjects and run analyses for distinct groups by specifying one or more By Variables.
Subject-specific filters must be created using the Create Subject Filter report prior to your analysis.