This report creates tabular and graphical overviews of treatment emergent adverse events for the safety population by actual treatment arm.
Note: For information about how treatment emergent adverse events (TEAEs) are defined in JMP Clinical, please refer to How does JMP Clinical determine whether an Event Is a Treatment Emergent Adverse Event?.
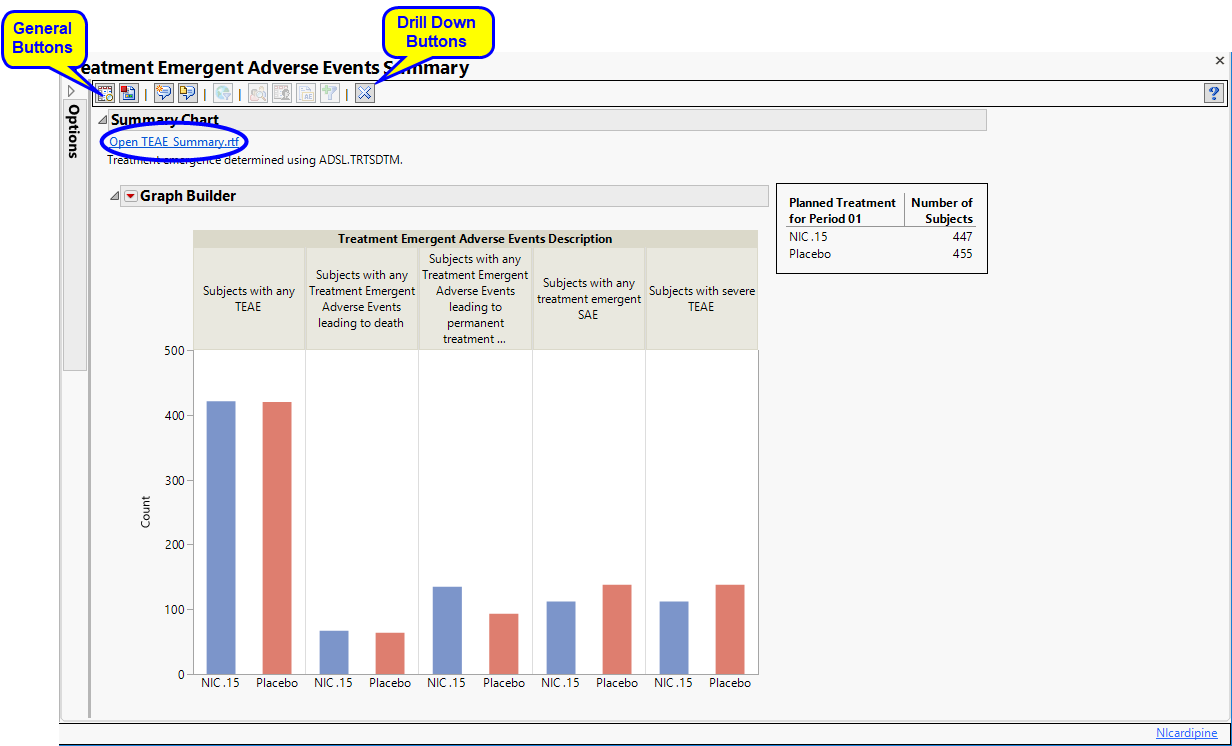
Running Treatment Emergent AE Summary for Nicardipine using default settings generates the Report shown below.
|
•
|
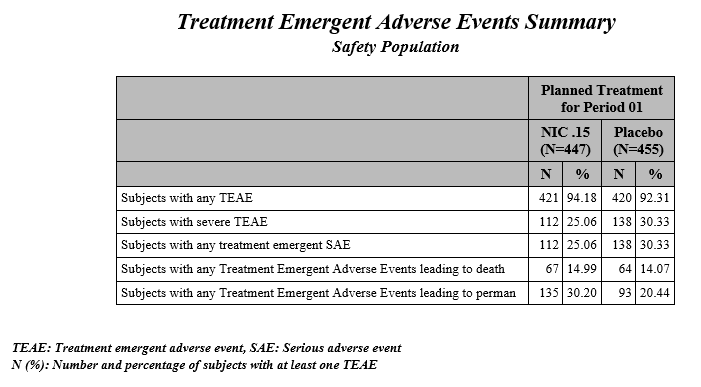
Summary Chart: This section contains a Bar Chart summarizing the counts of various treatment emergent adverse events by treatment. Click the Open TEAE Summary.rtf link to open an rtf file (shown below) that summarizes the treatment emergent adverse events. Percentages of subjects experiencing an event by arm are also included in this summary.
|
This enables you to subset subjects based on demographic characteristics and study site. Refer to Data Filter for more information.
|
•
|
Profile Subjects: Select subjects and click
|
|
•
|
Show Subjects: Select subjects and click
|
|
•
|
Cluster Subjects: Select subjects and click
|
|
•
|
AE Narrative: Select subjects and click
|
|
•
|
Demographic Counts: Select subjects and click
|
|
•
|
Click
|
|
•
|
Click
|
|
•
|
Click
|
|
•
|
Click
|
|
•
|
Click the arrow to reopen the completed report dialog used to generate this output.
|
|
•
|
Click the gray border to the left of the Options tab to open a dynamic report navigator that lists all of the reports in the review. Refer to Report Navigator for more information.
|
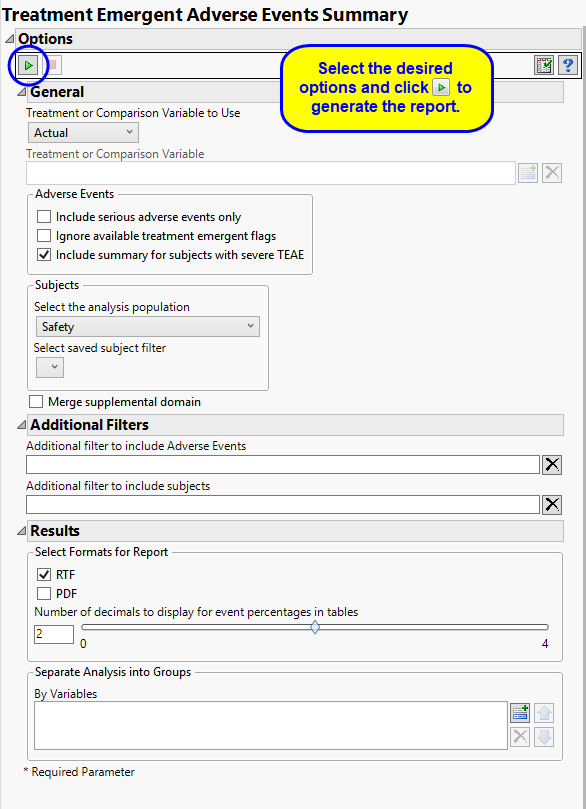
The primary goal of clinical trials is to distinguish treatment effects when reporting and analyzing trial results. Treatments are defined by specific values in the treatment or comparison variables of the CDISC models. These variables are specified in this report using the Treatment or Comparison Variable to Use andTreatment or Comparison Variable options.
Available variables include Planned, which is selected when the treatments patients received exactly match what was planned and Actual, which is selected when treatment deviates from what was planned.
You can also specify a variable other than the ARM or TRTxxP (planned treatment) or ACTARM or TRTxxA (actual treatment) from the CDISC models as a surrogate variable to serve as a comparator. Finally you can select None to plot the data without segregating it by a treatment variable.
By default, all events are included in the analysis. However, you can opt to include only those considered serious. Selecting the Include serious adverse events only option restricts the analysis to those adverse events defined as Serious under FDA guidelines.
If you choose to Ignore available treatment emergent flags, the analysis includes all adverse events that occur on or after day 1 of the study.
By default, the summary table and chart includes, by treatment patients with any TEAE, patients with any treatment emergent serious AE, patients with any TEAE leading to death, patients with any TEAE leading to permanent treatment discontinuation. Checking the Include summary for subjects with severe TEAE option also includes patients with severe TEAE
Filters enable you to restrict the analysis to a specific subset of subjects and/or adverse events, based on values within variables. You can also filter based on population flags (Safety is selected by default) within the study data.
If there is a supplemental domain (SUPPDS or SUPPMH) associated with your study, you can opt to merge the non-standard data contained therein into your data.
See Select the analysis population, Select saved subject Filter1, Merge supplemental domain, Additional Filter to include Adverse Events, and Additional Filter to Include Subjects
You can use the output options to specify the format (RTF or PDF) of the final report as well as the Number of decimals to display for event percentages in tables.
You can also subdivide the subjects and run analyses for distinct groups by specifying one or more By Variables.
Subject-specific filters must be created using the Create Subject Filter report prior to your analysis.