Running Standardized MedDRA Queries Distribution for the Nicardipine study using MedDRA Version 16.0 files generates the Report shown below.
Note: Your output might vary depending on which version of MedDRA you provide (in terms of the location of the *.asc files).
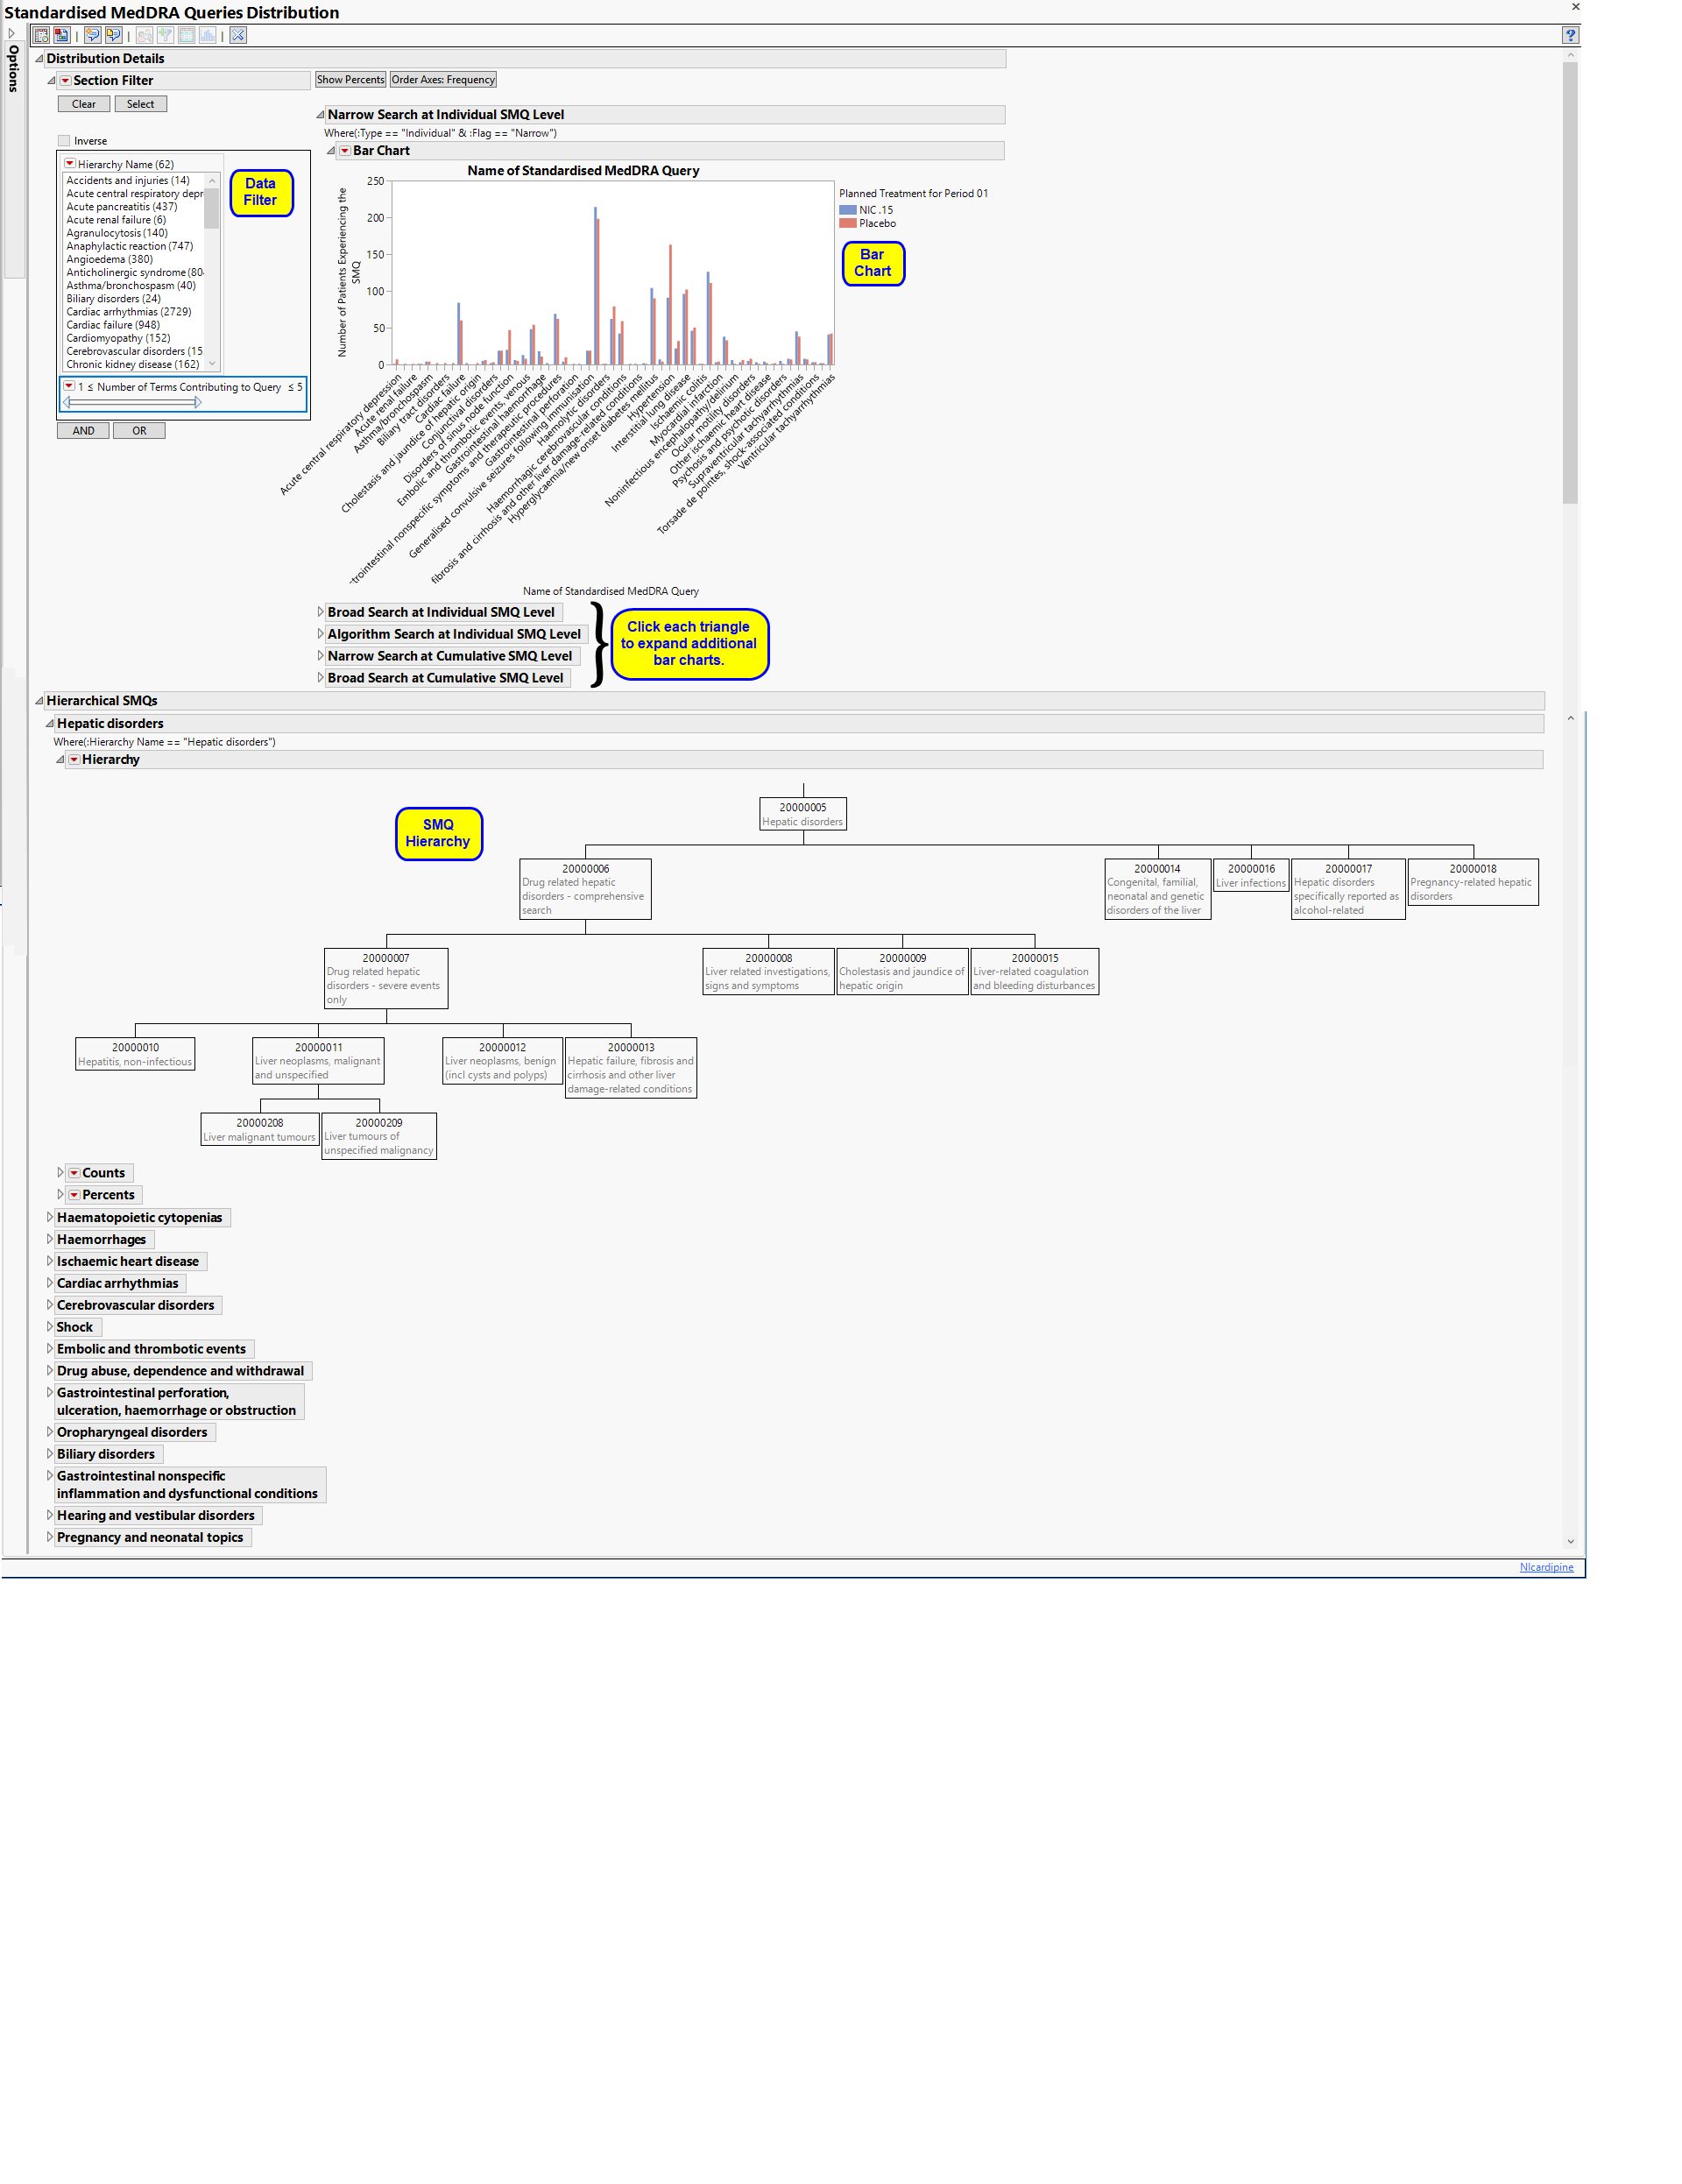
The Report contains the following elements:

Bar charts are provided to summarize the major classes of SMQ: a) Narrow Search at the Individual Term Level (open by default), b) Broad Search at the Individual Term Level, c) Algorithm Search at the Individual Term Level, d) Narrow Search at the Cumulative Term Level, or e) Broad Search at the Cumulative Term Level. The bars display the frequency or percentage by treatment of subjects that meet the criteria for each SMQ.
For non-hierarchical SMQs, the results of individual or cumulative analyses are identical. For hierarchical SMQs, cumulative analyses include SMQs from all sub-SMQs. For example, view the Hepatic Disorders hierarchy on the Hierarchical SMQs tab. An individual-level analysis for Liver Neoplasms, malignant, and unspecified would contain only those SMQs that fall within cell 20000011; the cumulative analysis would include SMQs from 20000011, and the sub-SMQs 20000208 and 20000209.
See Graph Builder documentation for more information.
|
•
|
A Data Filter.
|
This enables you to subset subjects based on demographic characteristics and other criteria. Refer to Data Filter for more information.
Summarizes hierarchical SMQs graphically and provides observed and cumulative sample sizes and percentages of SMQs.
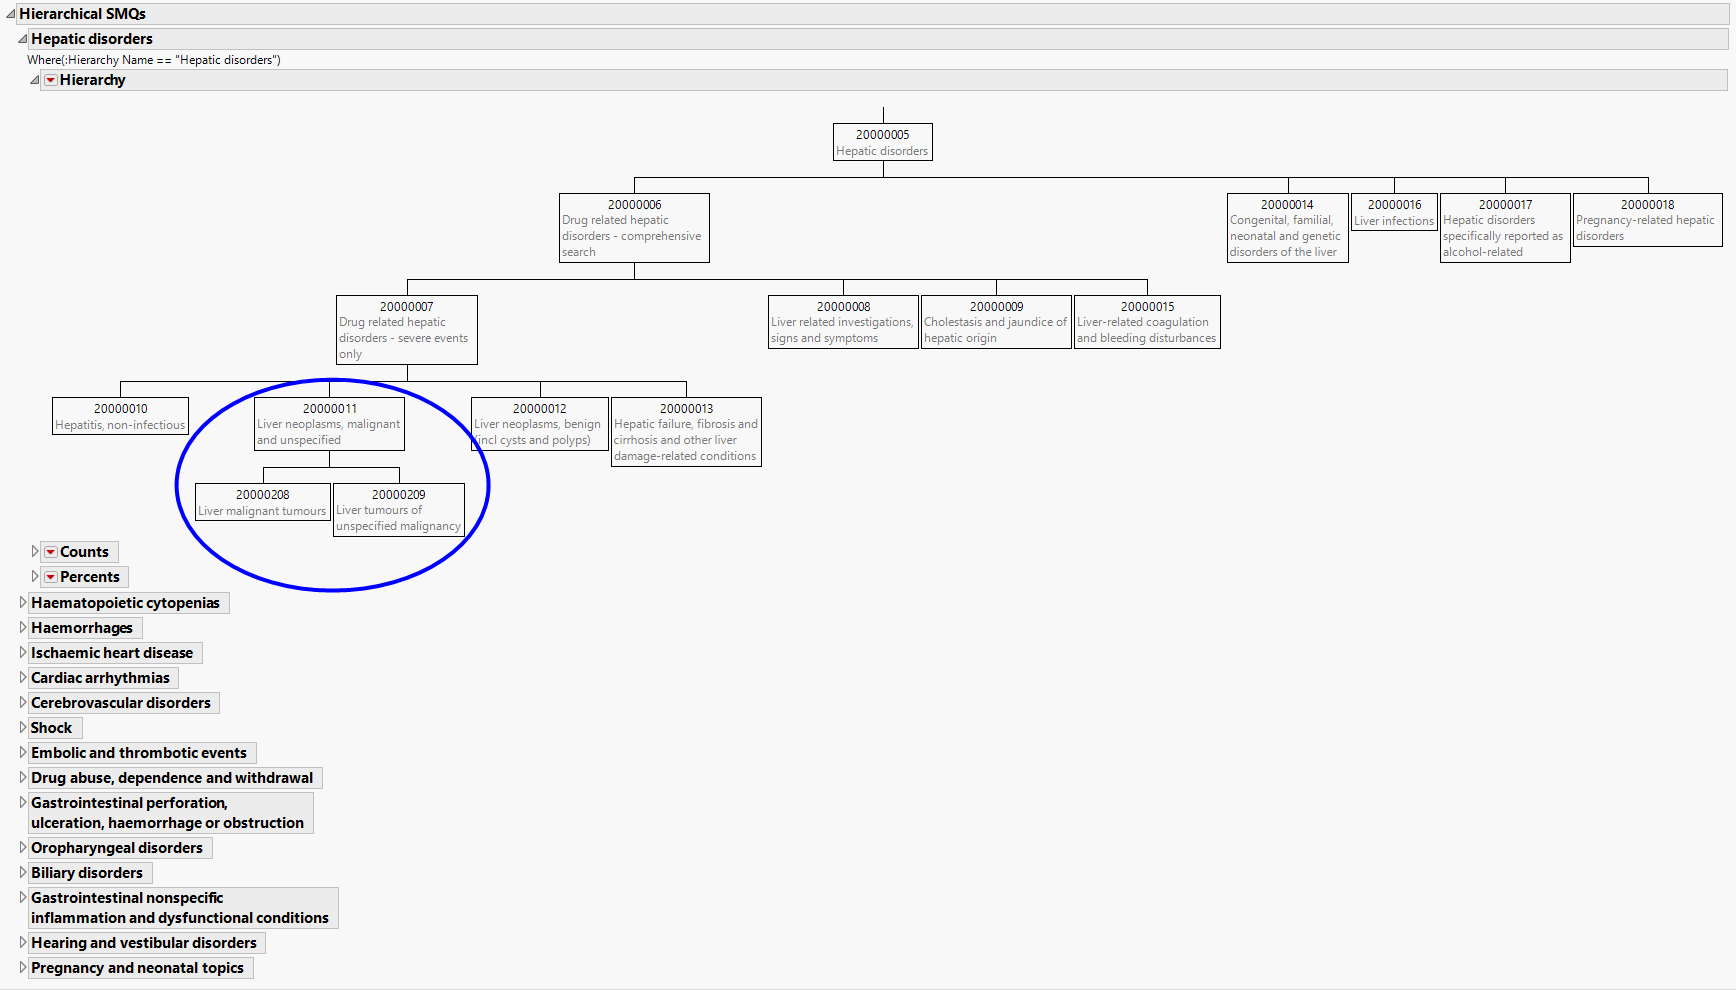
The Hierarchical SMQs section contains the following elements:
The hierarchy plots illustrate the grouping relationship of several related SMQs. Tables below each hierarchy provide the counts and percents of subjects that experience the SMQs both individually and cumulatively.
|
•
|
Profile Subjects: Select subjects and click
|
|
•
|
Demographic Counts: Select subjects and click
|
|
•
|
Show SMQs: Select SMQs from the plots and click
|
|
•
|
Show Events Leading to SMQs: Select SMQs from the plots and click
|
|
•
|
Click
|
|
•
|
Click
|
|
•
|
Click
|
|
•
|
Click
|
|
•
|
Click the arrow to reopen the completed report dialog used to generate this output.
|
|
•
|
Click the gray border to the left of the Options tab to open a dynamic report navigator that lists all of the reports in the review. Refer to Report Navigator for more information.
|
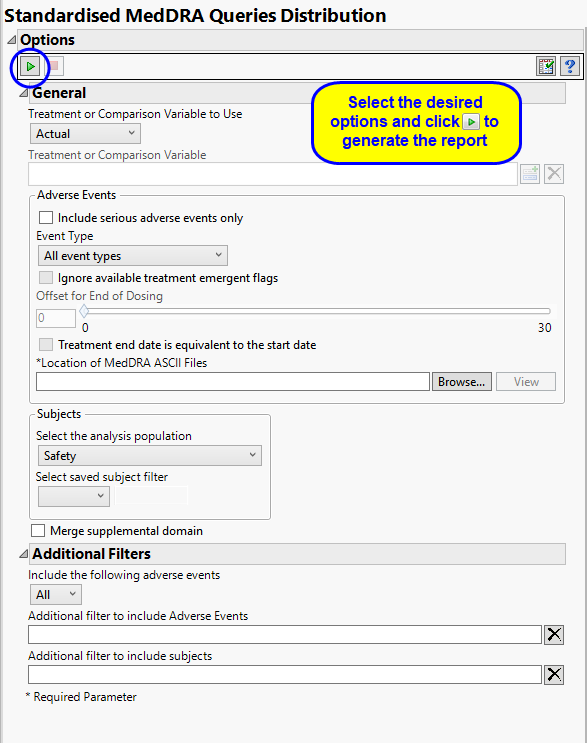
The primary goal of clinical trials is to distinguish treatment effects when reporting and analyzing trial results. Treatments are defined by specific values in the treatment or comparison variables of the CDISC models. These variables are specified in this report using the Treatment or Comparison Variable to Use andTreatment or Comparison Variable options.
Available variables include Planned, which is selected when the treatments patients received exactly match what was planned and Actual, which is selected when treatment deviates from what was planned.
You can also specify a variable other than the ARM or TRTxxP (planned treatment) or ACTARM or TRTxxA (actual treatment) from the CDISC models as a surrogate variable to serve as a comparator. Finally you can select None to plot the data without segregating it by a treatment variable.
By default, all events are included in the analysis. However, you can opt to include only those considered serious. Selecting the Include serious adverse events only option restricts the analysis to those adverse events defined as Serious under FDA guidelines.
Analysis can consider all events or only those that emerge at specific times before, during, or after the trial period. For example, selecting On treatment events as the Event Type includes only those events that occur on or after the first dose of study drug and at or before the last dose of drug (+ the offset for end of dosing).
If you choose to Ignore available treatment emergent flags, the analysis includes all adverse events that occur on or after day 1 of the study.
By default, post-treatment monitoring begins after the patient receives the last treatment. However, you might want to specify an Offset for End of Dosing, increasing the time between the end of dosing and post-treatment monitoring for treatments having an extended half-life.
Check the Treatment end date is equivalent to the start date if the treatment end date (EXTENDTC) is missing from the data. In this case, it is assumed that all treatments were given on the same day and that the treatment start date can be used instead.
See Location of MedDRA ASCII Files for more information.
Filters enable you to restrict the analysis to a specific subset of subjects and/or adverse events, based on values within variables. You can also filter based on population flags (Safety is selected by default) within the study data.
If there is a supplemental domain (SUPPDS or SUPPMH) associated with your study, you can opt to merge the non-standard data contained therein into your data.
See Select the analysis population, Select saved subject Filter1, Merge supplemental domain, Additional Filter to include Adverse Events, and Additional Filter to Include Subjects
Subject-specific filters must be created using the Create Subject Filter report prior to your analysis.