This report displays the box plots by treatment group representing the change from baseline in measurements for each test for specified findings domain across various time s or points in the study. Time s can be specified using a list of bracketed times or, alternatively, a number of time s can be set to create time s that span across the entire study.
If the variable xxBLCHG (where xx is substituted with the chosen domain 2 letter code) exists, this variable is used in plotting change from baseline. Otherwise, a measurement is determined to be a baseline measurement by the ABLFL or xxBLFL variable where xx is substituted with the 2-letter code for the chosen domain for analysis. If this variable does not exist, baseline is calculated from measurements taken on or before day 1 of the study. A time can be specified to determine baseline measurements.
Note: JMP Clinical uses a special protocol for data including non-unique Findings test names. Refer to How does JMP Clinical handle non-unique Findings test names? for more information.
Running Findings Box Plots for Nicardipine using default settings generates the report shown below. Output from the report is organized into sections. Each section contains one or more plots, data panels, data filters, or other elements that facilitate your analysis.
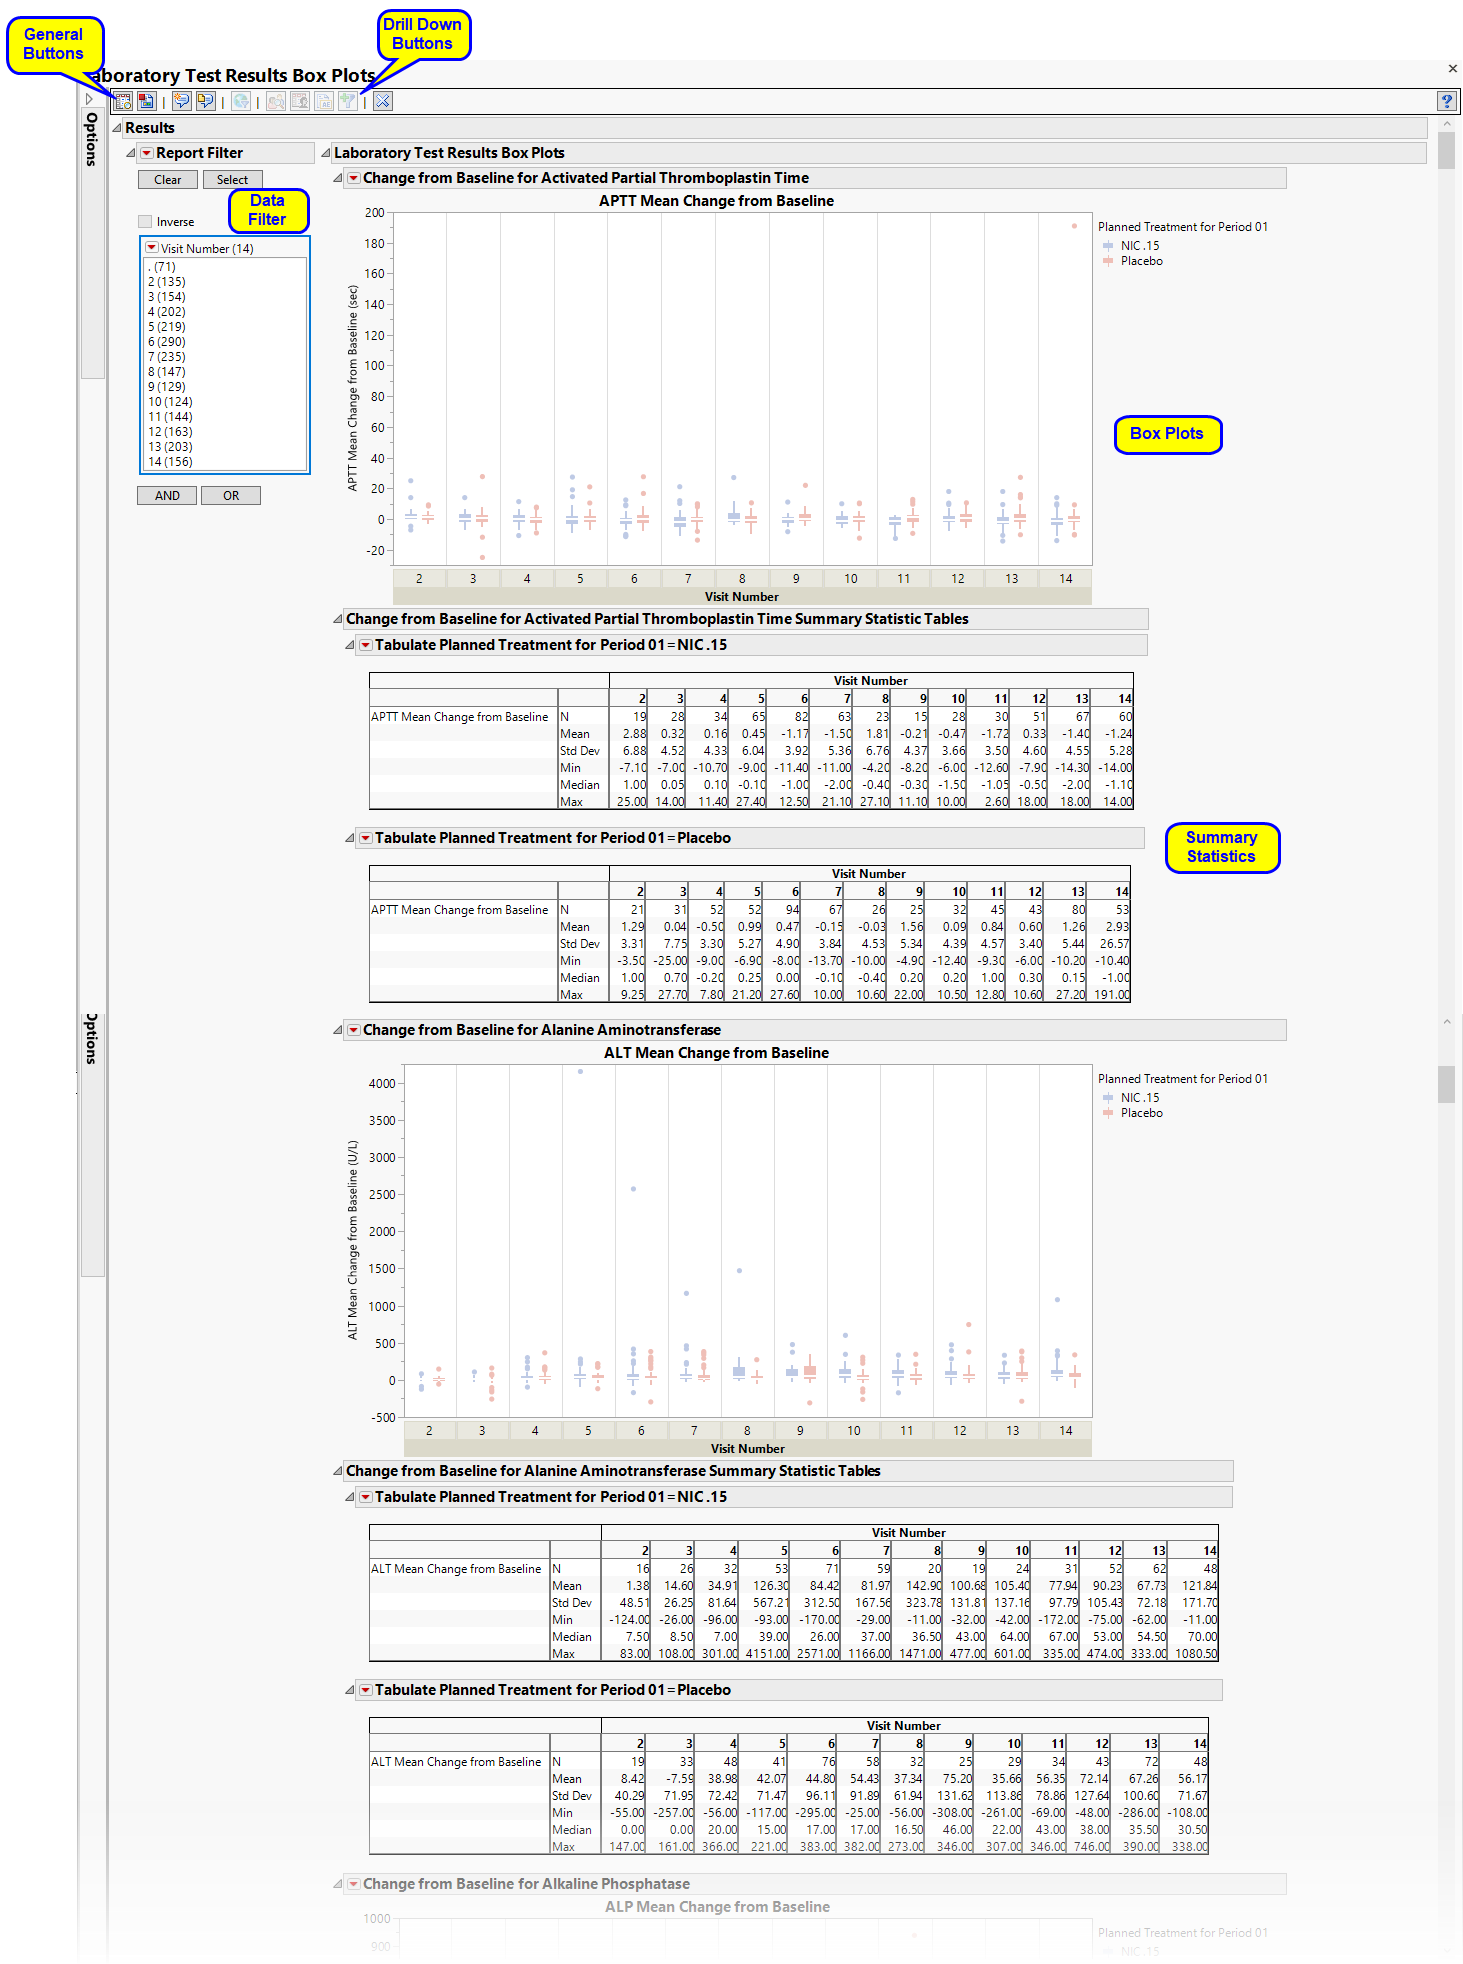
Presents several Box Plots representing the values chosen in Plot findings measurements as: option.The name of this section varies based on the domain chosen.
Note: The name of this section and the findings results (LB, VS, or EG) displayed depend on the domain selected using the Findings Domain to Analyze option.
Each box plot set represents an xxTESTCD from the selected domain. For example, in the graph above, the first figure represents the change from baseline for APTT (Activated Partial Thromboplastin Time) at each visit for both treatment arms. The tables presents the associated statics.
This enables you to subset subjects based on demographic characteristics and other factors. Refer to Data Filter for more information.
|
•
|
Profile Subjects: Select subjects and click
|
|
•
|
Show Subjects: Select subjects and click
|
|
•
|
Cluster Subjects: Select subjects and click
|
|
•
|
Demographic Counts: Select subjects and click
|
|
•
|
Click
|
|
•
|
Click
|
|
•
|
Click
|
|
•
|
Click
|
|
•
|
Click the arrow to reopen the completed report dialog used to generate this output.
|
|
•
|
Click the gray border to the left of the Options tab to open a dynamic report navigator that lists all of the reports in the review. Refer to Report Navigator for more information.
|

Use the Findings Domain to Analyze option to specify whether to plot the distribution of measurements from either the Electrocardiogram (EG), Laboratory (LB), or Vital Signs (VS) findings domains. LB is selected by default.
You can use the Findings Domain Tests for Analysis option to plot the distributions of one or more selected findings tests. Leaving the field blank (the default selection) plots the distributions for all available findings tests.
The primary goal of clinical trials is to distinguish treatment effects when reporting and analyzing trial results. Treatments are defined by specific values in the treatment or comparison variables of the CDISC models. These variables are specified in this report using the Treatment or Comparison Variable to Use andTreatment or Comparison Variable options.
Available variables include Planned, which is selected when the treatments patients received exactly match what was planned and Actual, which is selected when treatment deviates from what was planned.
You can also specify a variable other than the ARM or TRTxxP (planned treatment) or ACTARM or TRTxxA (actual treatment) from the CDISC models as a surrogate variable to serve as a comparator. Finally, you can select None to plot the data without segregating it by a treatment variable.
Refer to Plot findings measurements as: and Show ULN and LLN reference lines for lab tests for more information.
You might or might not want to include unscheduled visits when you are analyzing findings by visit. Check the Remove unscheduled visits to exclude unscheduled visits.
Filters enable you to restrict the analysis to a specific subset of subjects and/or findings records, based on values within variables. You can also filter based on population flags (Safety is selected by default) within the study data.
If there is a supplemental domain (SUPPXX) associated with your study, you can opt to merge the non-standard data contained therein into your data.
See Select the analysis population, Select saved subject Filter1, Merge supplemental domain, Include the following findings records:, Additional Filter to Include Findings Records, and Additional Filter to Include Subjects2
By default, time is measured by visits. However, you can change the Time Scale to measure time in either weeks or days. This option is useful for assessing report graphics for exceptionally long studies.
To establish a baseline measurement for each finding, you must specify the time period (usually prior to day one of the study) and whether to use on or more than one measurement. Use the Baseline Time Window option to specify the time period during which baseline measurements are taken and the Calculate baseline as: option to use the last pre-dose measurement or the mean of all the measurements taken during the baseline time window as the baseline measurement.
When analyzing findings results by either days or weeks instead of by visit, you must specify one or more time window parameters. Time windows are defined blocks of time within the study where findings results are considered in a single time point regardless of where within the window they were collected. The Time Window Method option enables you to specify either a number of time points of equal length that span the study, several individual time points of varying define lengths that might or might not span the study, or no time windows. In that case, each time is considered individually. If you select None, no other time window parameters are specified. If you select Set Number of Time Windows, you must also specify the Number of Time Windows. If you select Use Time Windows list, you must specify the start and end days for each of the Trial Time Windows.
When you select None as the Time Window Method, box plots for the maximum, mean, median, and minimum values are shown for each subject across the entire trial for each subject. When you list or select a number of time trials, only one statistic is shown. Use the Summary Statistic to Compute Within Time Windows or Visits option to specify the statistic to be displayed.
By default, tables displaying selected summary statistics for each findings test are displayed in the report output. Use the Summary Statistics to Display in Tables and Number of decimals to display for summary statistics in tables options to select the statistics and number of decimal places to be displayed.
Uncheck the Display Visit summary statistic tables for each findings test option to omit these tables.
You can specify the number of decimal places for reporting calculated summary statistics for the findings tables using the Number of decimals to display for event percentages in tables option.
You can also subdivide the subjects and run analyses for distinct groups by specifying one or more By Variables.
Subject-specific filters must be created using the Create Subject Filter report prior to your analysis.