This report generates an exposure plot for all subjects in a study for an investigational product by dose and exposure time for the safety population treatment. Summaries of exposure duration for subjects are also produced along with a static report of counts of total duration periods for subjects. The duration report and summary can be produced for specific duration times only through use of a duration time s list on the Exposure Duration tab. The exposure plot is generated for all subjects across any time of exposure.

The Report contains the following elements:
Displays three plots showing the percent of subjects who remain on the study medication by Day of Study, the distribution of doses by arm, and a list of dose descriptive statistics by ARM along with a Box Plot of doses.

|
•
|
The first shows the percentage of subjects remaining in each arm (plotted on the Y axis) on each assayed day of the study (plotted on the X axis). The percentages in each arm are calculated by using the number of remaining subjects assigned to that arm as the numerator and the total count of subjects who have been assigned to the arm as the denominator.
The second plot shows the distribution of doses among each arm's subjects in terms of a percentage of the maximum total number of doses received throughout the study in each treatment arm.
|
•
|
Box Plots and a table of descriptive statistics of the cumulative number of doses taken by treatment value.
|
Presents a Histogram for the total duration of exposure in terms of the number of days exposed to treatment.
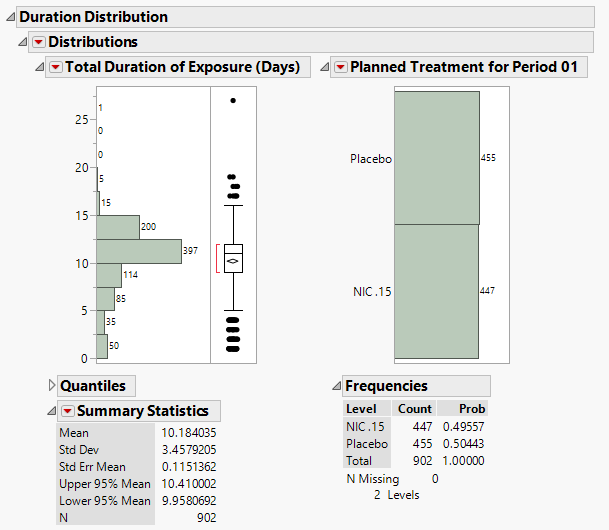
Presents a histogram for the total duration of exposure in terms of the number of days exposed to treatment. A second histogram summarizes the distribution of the treatment variable.
See Distribution for more information.
|
•
|
One Data Filter.
|
This enables you to subset subjects based on treatment, demographics, and study site. Refer to Data Filter for more information.
Note: You can toggle between viewing percentage or number of subjects by clicking .
|
•
|
Profile Subjects: Select subjects and click
|
|
•
|
Show Subjects: Select subjects and click
|
|
•
|
Demographic Counts: Select subjects and click
|
|
•
|
Click
|
|
•
|
Click
|
|
•
|
Click
|
|
•
|
Click
|
|
•
|
Click the arrow to reopen the completed dialog used to generate this output.
|
|
•
|
Click the gray border to the left of the Options tab to open a dynamic report navigator that lists all of the reports in the review. Refer to Report Navigator for more information.
|
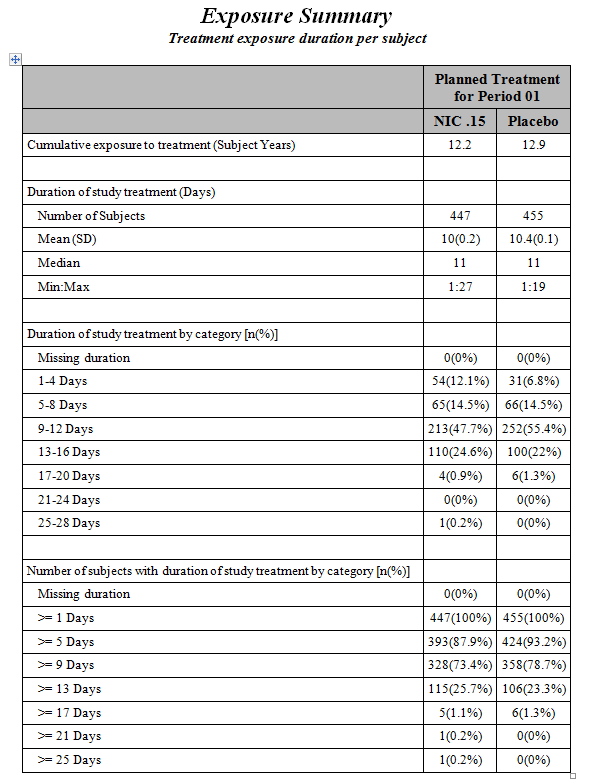
An Exposure Summary Report is also generated. Click the Open Exposure Summary link to view this report. It summarizes the dosing in terms of Subject Years, presents summary statistics of subjects’ exposure to treatment, the frequency of subjects within exposure categories (number and range determined by Number of Duration Time Windows and Duration Time Windows in the dialog), and the cumulative frequency within exposure categories. If Exposure Duration (EXDUR) is missing and end date/time of treatment (EXENDT) is incomplete or missing for a subject(s), the subject(s) are excluded from the min/max duration times in the report.
|
•
|
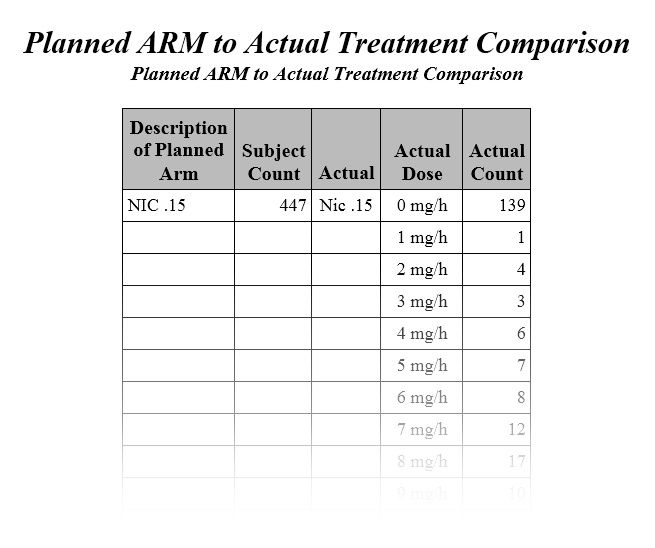
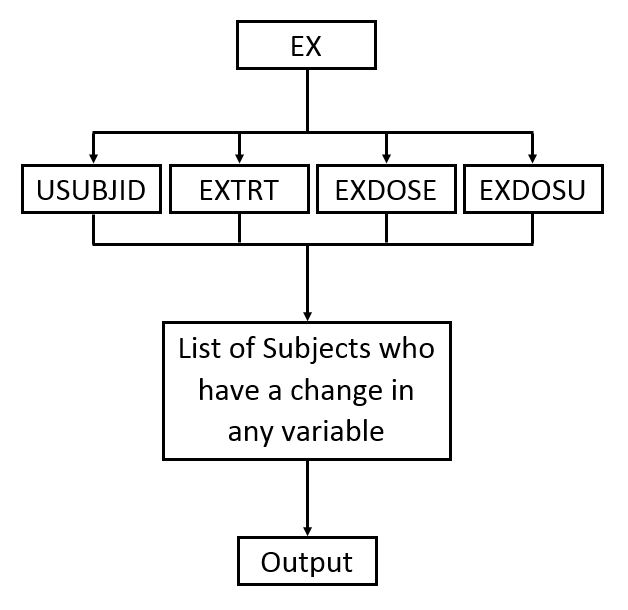
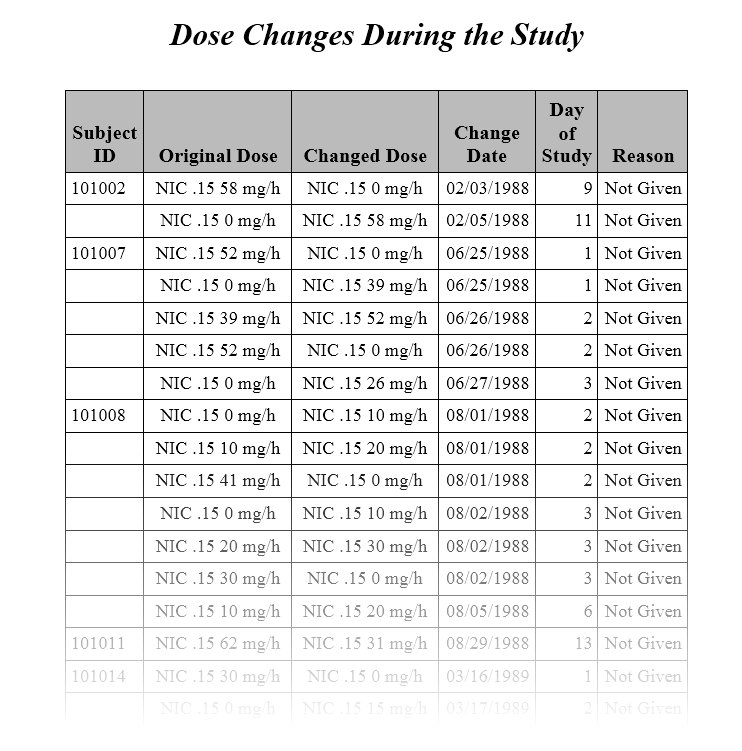
The second Table (shown above) lists the changes in dosage each subject received over the course of the study. JMP Clinical uses data from USUBJID, EXTRT, EXDOSE, and EXDOSU to generate the list of subjects with dosage changes reported in the table (as shown in the diagram below).
|
The original dose and the changed dose are calculated using combined data from EXTRT/EXDOSE/ EXDOSU. The date and reason the dosage was changed are provided by EXENDTC and EXADJ. The default response of Not Given is shown whenever EXADJ is either empty or non-existent.
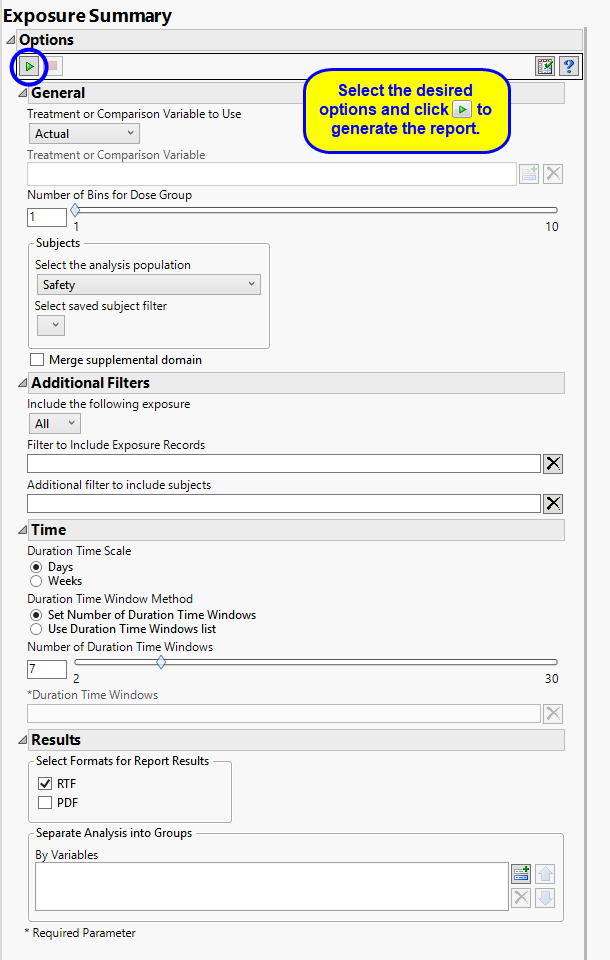
The primary goal of clinical trials is to distinguish treatment effects when reporting and analyzing trial results. Treatments are defined by specific values in the treatment or comparison variables of the CDISC models. These variables are specified in this report using the Treatment or Comparison Variable to Use andTreatment or Comparison Variable options.
Available variables include Planned, which is selected when the treatments patients received exactly match what was planned and Actual, which is selected when treatment deviates from what was planned.
You can also specify a variable other than the ARM or TRTxxP (planned treatment) or ACTARM or TRTxxA (actual treatment) from the CDISC models as a surrogate variable to serve as a comparator. Finally you can select None to plot the data without segregating it by a treatment variable.
The Number of Bins for Dose Group option enables you to specify the number of bins into which the subjects receiving different treatment dosages, as reported in the EXDOSE variable in the ex.sas7bdat data set, are to be grouped. Binning the dosage groups reduces the number of groups to be plotted on a graph and facilitates visual inspection of the results. This option is useful when the number of dosage groups is very large.
Filters enable you to restrict the analysis to a specific subset of subjects and/or exposure records, based on values within variables. You can also filter based on population flags (Safety is selected by default) within the study data.
If there is a supplemental domain (SUPPCM or SUPPEX) associated with your study, you can opt to merge the non-standard data contained therein into your data.
See Select the analysis population, Select saved subject Filter1, Merge supplemental domain, Include the following exposure, Filter to Include Exposure Records, and Additional Filter to Include Subjects2 or more information.
Duration of exposure refers to the total length of time during the study that a subject underwent treatment and it is based on the recorded exposure times to the drug. The duration is measured in either days or weeks, depending on the length of the study Use the Duration Time Scale option to specify the scale by which you report exposure duration. Days is specified by default.
When analyzing duration, you must specify one or more time window parameters. Time windows are defined blocks of time within the study where results are considered in a single time point regardless of where within the window they were collected. All observations taken within an window are plotted together. The Duration Time Window Method option enables you to specify either a number of time points of equal length that span the study or a series of defined time windows.
If you select Set Number of Duration Time Windows, you must also specify the Number of Duration Time Windows. In this case the final report lists the number of patients that fall into each exposure window.
If you select Use Duration Time Windows list, you must specify the start and end days for each of the Duration Time Windows. In this case, the final report lists the number of patients that fall into the specified exposure windows only.
You can also subdivide the subjects and run analyses for distinct groups by specifying one or more By Variables.
Subject-specific filters must be created using the Create Subject Filter report prior to your analysis.