This process uses the TR, TU (optional), and RS (optional) oncology domains to create spider plots showing tumor results and waterfall plots showing Best or Last recorded responses. Spider plots may be annotated with new lesions or selected disposition events. Measurements plotted on the spider plot and summarized in the waterfall plot represent change or percent change of tumor burden from baseline in measurable/target lesions. For direct lesion measurement tests such as LDIAM or DIAMETER, lesions are summed and compared to the baseline lesion summation by study visit or study day. If a derived summary test such as the sum of diameters or percent change from baseline is run, then the report will plot the recorded values across time for subjects with recorded measurements.
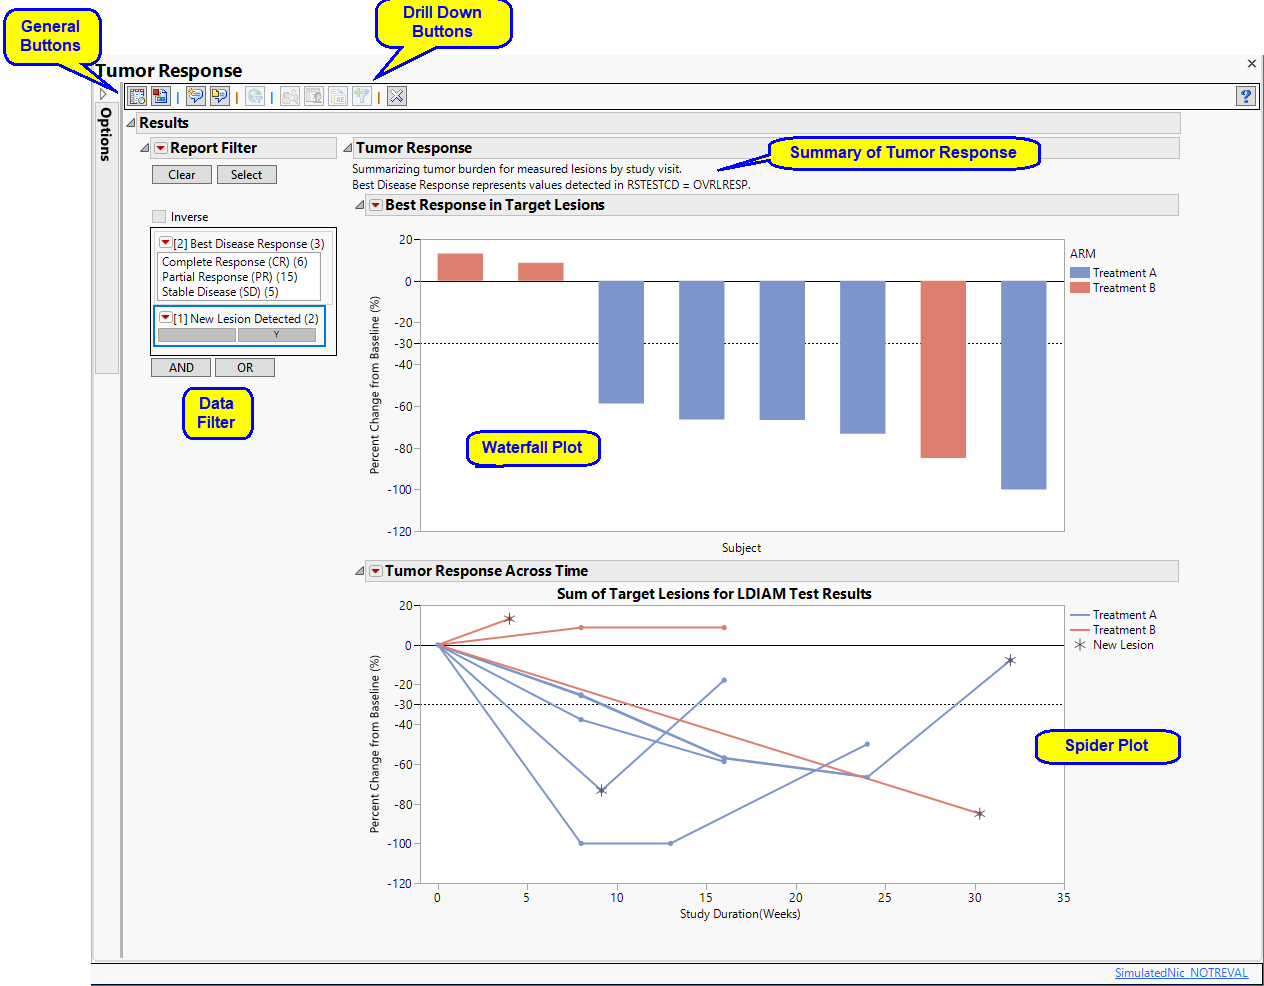
Running this report for a modified Nicardipine study using default settings generates the report shown below.
|
•
|
Summary text stating whether the report is summarizing tumor burden by study day or visit number. This note will also indicate which test was used when both RS exists and the best disease response is to be displayed.
|
is surfaced when the Filter to only include Target Lesions in numeric result summaries option is checked (the default setting) and the report cannot detect the tumor identification method. In addition, in the case where the identifying variables typically either don't exist or contain information about the target lesions, it is likely that new lesion information will not be available.
This plot shows the “best” percent change in overall tumor burden1 relative to the baseline for each subject that occurred during the study period. Bars above Baseline2 represent overall tumor growth, bars below baseline represent overall tumor shrinkage. Bar color corresponds to treatment. Subjects who show no change in tumor size are represented by a + symbol on the plots instead of a bar.
This Overlay Plot shows the percent change in tumor size relative to the baseline for each subject at each visit over the course of the study. The appearance of a new lesion is indicated by an asterisk ( ).
).
Note: Dotted lines are drawn on each plot to indicate minimal changes in summed target lesions required for partial response (-30%) or progressive disease (+20%).
|
•
|
One Report Filter.
|
This enables you to subset subjects based on their best disease response and whether or not new lesions were detected. Refer to Data Filter for more information on specifying additional filtering criteria.
Note: When the study includes multiple evaluators (as specified in TREVAL), the report generates a separate waterfall plot and spider plot for each evaluator. Each plot displays only those subjects assessed by the evaluator. If there is a case where a subject is assessed by multiple evaluators, the responses from all evaluators are shown, so long as there are not multiple IDs (TREVALID). In this case only the responses collected by the evaluator flagged in TRACPTFL.
|
•
|
|
•
|
Profile Subjects: Select subjects and click
|
|
•
|
Show Subjects: Select subjects and click
|
|
•
|
Adverse Events Narrative Generation: Select subjects and click
|
|
•
|
Create Subject Filter: Click
|
|
•
|
Click
|
|
•
|
Click
|
|
•
|
Click
|
|
•
|
Click
|
|
•
|
Click the arrow to reopen the completed dialog used to generate this output.
|
|
•
|
Click the gray border to the left of the Options tab to open a dynamic report navigator that lists all of the reports in the review. Refer to Report Navigator for more information.
|

The primary goal of clinical trials is to distinguish treatment effects when reporting and analyzing trial results. Treatments are defined by specific values in the treatment or comparison variables of the CDISC models. These variables are specified in this report using the Treatment or Comparison Variable to Use and Treatment or Comparison Variable options.
Available variables include Planned, which is selected when the treatments patients received exactly match what was planned and Actual, which is selected when treatment deviates from what was planned.
You can also specify a variable other than the ARM or TRTxxP (planned treatment) or ACTARM or TRTxxA (actual treatment) from the CDISC models as a surrogate variable to serve as a comparator.
Use Tumor Results Test for Analysis option to select the test to be used both for creating the summary measurement value to plot by time in the spider plot and to summarize in the waterfall plot where each subject is represented with a bar whose height is determined by the calculated Best or Last value.
Use the Default value for lesions marked TOO SMALL TO MEASURE option to specify a value to replace when TRSTRESN is missing and the TRSTRESC result has a value of TOO SMALL TO MEASURE. Per RECIST guidelines, this should be a value of 5mm.
Use the Summarize tumor lesion measurement results by: option to select either Study Visit or Study Day as the time period to summarize the results by. Selecting Study Visit uses VISIT/VISITNUM and potentially Time Point (TRTPT if detected) for defining groups of lesions that should be aggregated to create a measurement for tumor burden. Alternatively, selecting Study Day sums lesions based on the date of the test (transformed into days relative to study start).
Use the Plot tumor results measurements as: option to select the type of findings measurement values to plot. Selecting Change from baseline plots the change from the findings baseline measurements (determined by the xxBLFL variable or by Study Day less than 1). Selecting Percent Change from Baseline plots the percent change from the findings baseline measurements. Percent Change from Baseline is specified by default.
Use the Tumor Result Summary to Display in Waterfall Plot option to select the statistic by which to summarize the data from the trial period. (The mean is always used to summarize data from the baseline period.) Best refers to best overall response. Last refers to the last observed value.
When the Filter to only include Target Lesions in numeric result summaries option is checked, the report algorithm attempts to find target lesion information based on values in the following SDTM identifying variables (in order of preference for detection): TRGRPID, TRCAT, TUSTRESC or TUORRES (via unique TRLNKID to TULNKID). If the values of the determined variable contains TARGET and does not contain values such as NEW, NON-TARGET, or NOT TARGET, then these records are only used for evaluating tumor result measurements for plots. When this option is unchecked, any record for the selected or determined TRTEST for analysis that has a numeric result (TRSTRESN) is included in the calculation and summary plots.
Unscheduled visits can occur for a variety of reasons. By default, these are excluded from this analysis. However, by unchecking the Remove unscheduled visits box, you have the option of including them.
If there is a supplemental domain (SUPPXX) associated with your study, you can opt to merge the non-standard data contained therein into your data.
See Select the analysis population, Select saved subject Filter3, Merge supplemental domain, Additional Filter to include tumor results records, and Additional Filter to Include Subjects for more information.
By default, subject identifiers are not included on the waterfall plots. Click the Display Subject Identifiers on Waterfall Plot x-Axis box to display the subject identifiers on the x-axes of the plots.
The Annotate Plots with Selected Disposition Events option enables you to annotate the output plots with selected disposition events. This feature enables you to quickly identify subjects experiencing those events and when during the study the event occurred.
Use the Annotate disposition events and new lesions that occur between tumor results visits: option to annotate visits (in the spider (line trend) plot) before or after the occurrence of a new lesion or disposition event when the study day (determined by TRDTC or DSDTC for new lesions or disposition events respectively) is between tumor lesion summary measurement results.
Use the Only mark the first occurrence of a new lesion for each subject to annotate the first occurrence of any new lesion only per subject in the spider (line trend) plot. New lesions are marked with an asterisk at the visit where it occurred or anchored to a visit value based on the comparison of study day and the preference set on the report options to annotate either prior/after the occurrence if the new lesion detection falls between valid measured tumor lesion summary days. This option is checked by default. If unchecked, all records with a valid date and whose tumor identification contains NEW are marked.
By default, the report marks only the occurrence of disposition events for a given subject on the spider/trend plot. If the Mark subjects with selected disposition events in the waterfall plot option is checked, then a black point marker is also used just above the best/last summary response value for a given subject in the waterfall plot provided the subject has any of the selected disposition events recorded.
By default, time is measured in weeks. However, you can change the Time Scale for trend plot x-Axis to plot time in either months, weeks or days. This option is useful for assessing report graphics for exceptionally long studies.
Baseline value is determined by the xxBLFL variable or by the last measurement taken before Study Day=1. The values for all tumors are then summed to calculate the tumor load at baseline.
Subject-specific filters must be created using the Create Subject Filter report prior to your analysis.