The Study Visits report generates graphical and tabular displays of and tabulation of study visit attendance. Additionally, a distribution of study days for a each specified visit is shown.
Running this report with the Nicardipine sample setting and default options generates the output shown below.
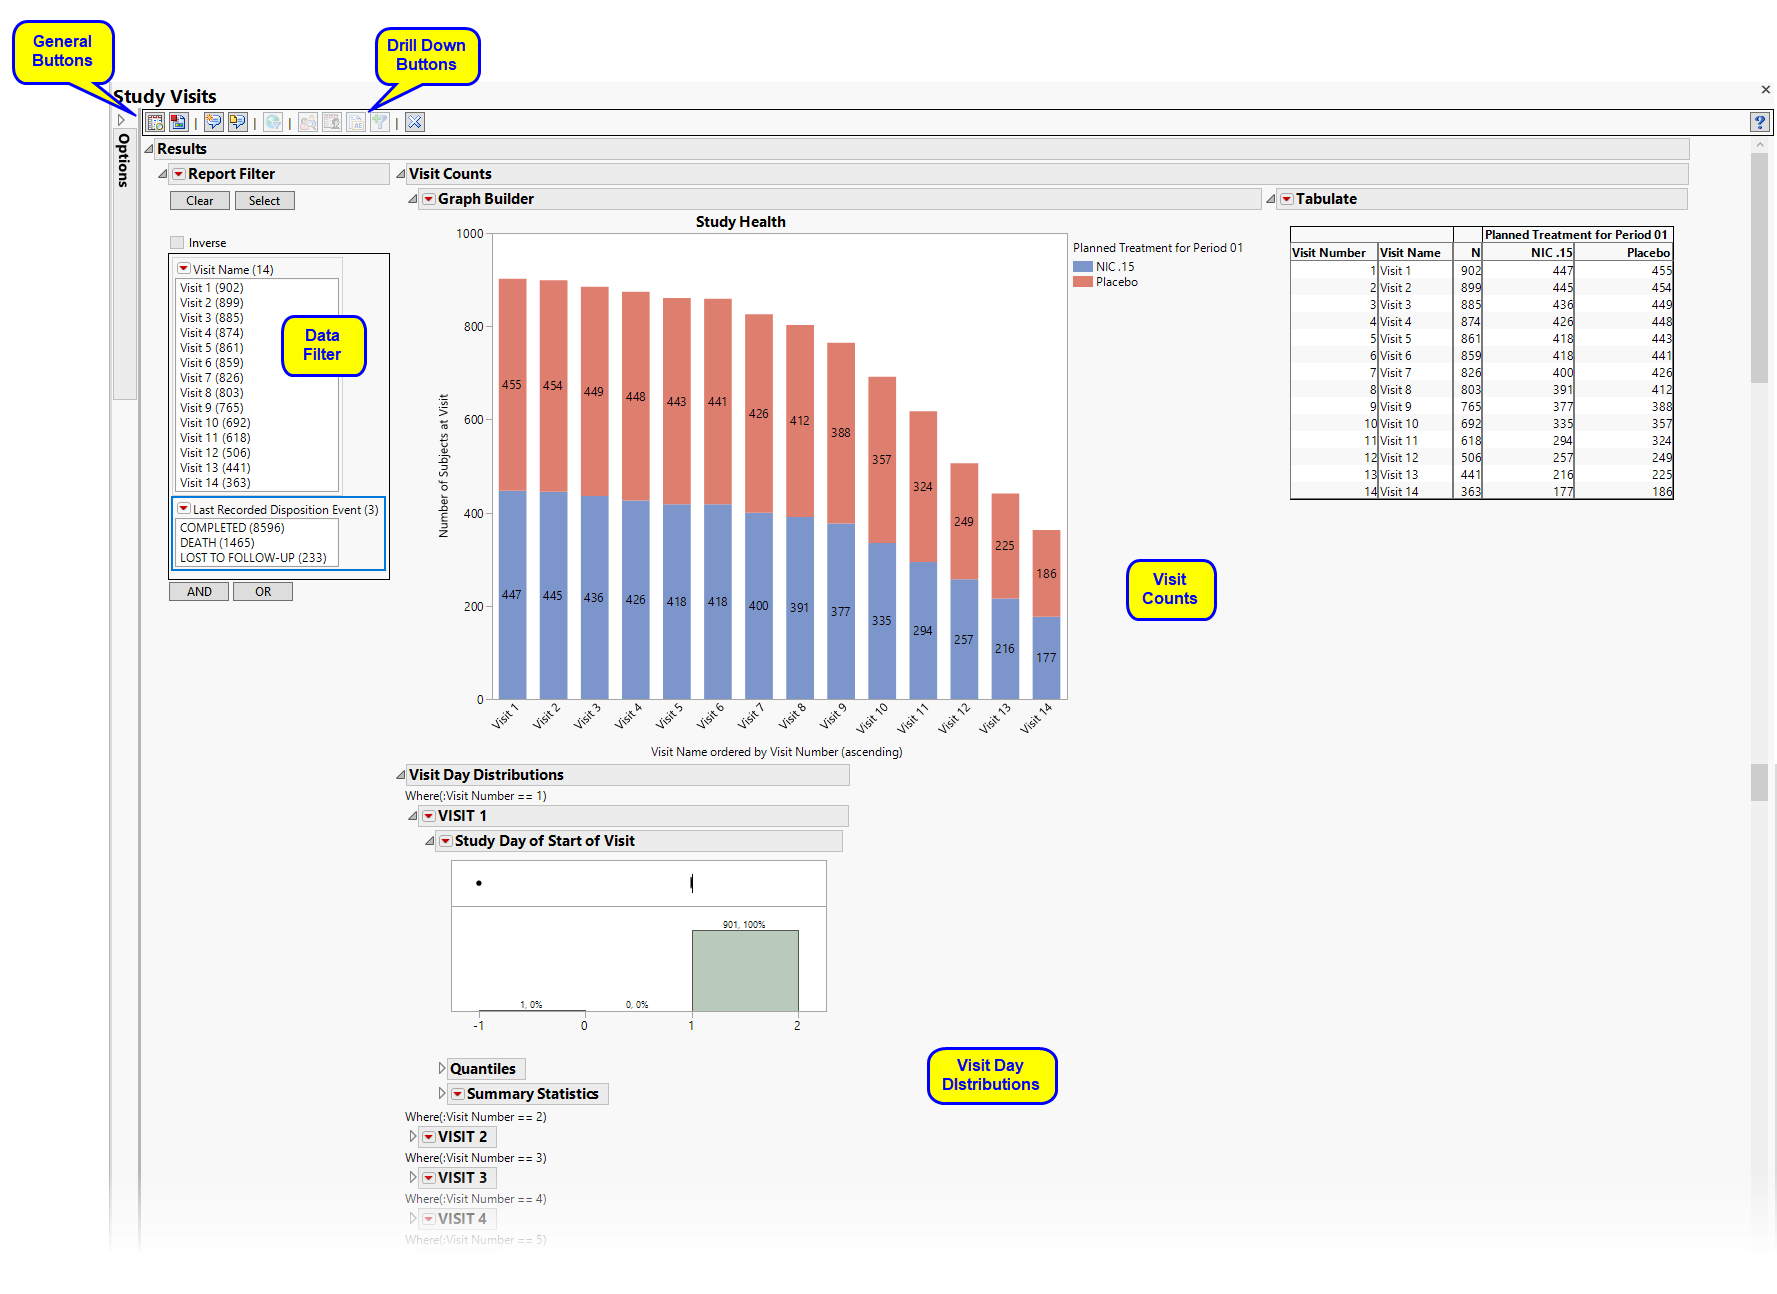
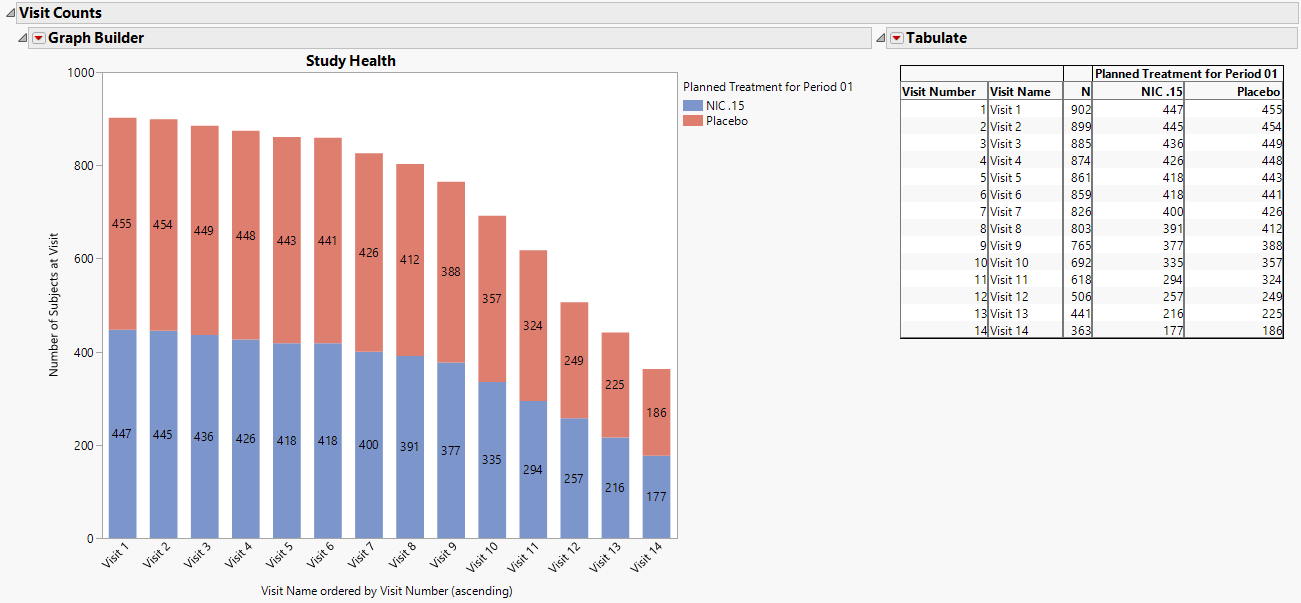
Presents a stacked Bar Chart colored by treatment and a table summarizing the number of subjects in each treatment ARM that attended each visit.
Presents a Histogram by visit of the study days on which the visits occur. Useful to identify whether subjects have gotten off schedule or if visit dates have been entered incorrectly. There is a separate distribution for each visit.
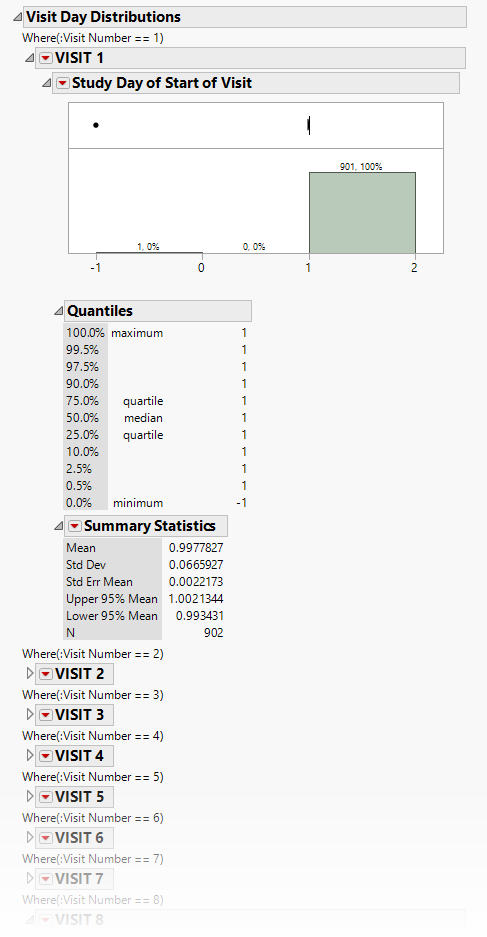
The histograms show the distribution of the study day for the start date of study visits by visit. They are useful in identifying whether subjects have gotten off schedule or whether visit dates have been entered incorrectly.
See Distribution for more information.
This enables you to subset subjects based on demographic characteristics and Standardized Disposition Terms. Refer to Data Filter for more information.
|
•
|
Profile Subjects: Select subjects and click
|
|
•
|
Show Subjects: Select subjects and click
|
|
•
|
Cluster Subjects: Select subjects and click
|
|
•
|
Demographic Counts: Select subjects and click
|
|
•
|
Click
|
|
•
|
Click
|
|
•
|
Click
|
|
•
|
Click
|
|
•
|
Click the arrow to reopen the completed report dialog used to generate this output.
|
|
•
|
Click the gray border to the left of the Options tab to open a dynamic report navigator that lists all of the reports in the review. Refer to Report Navigator for more information.
|
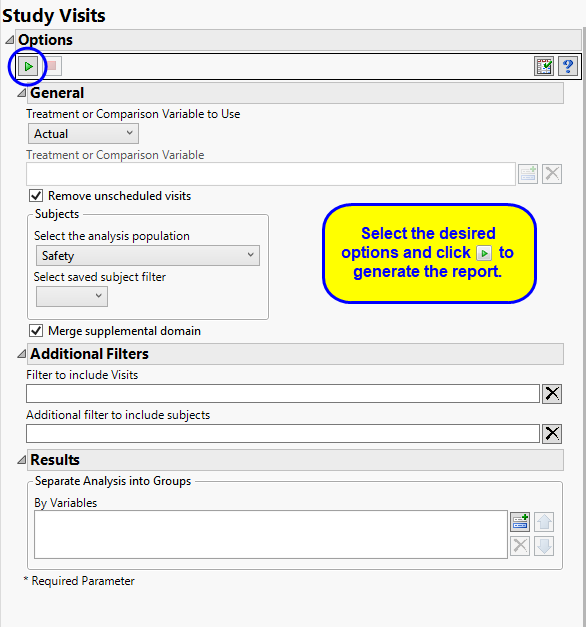
Available variables include Planned, which is selected when the treatments patients received exactly match what was planned and Actual, which is selected when treatment deviates from what was planned. You can also specify a variable other than TRTxxP (planned treatment) or TRTxxA (actual treatment). Finally you can select None to plot the data without segregating it by a treatment variable.
Unscheduled visits can occur for a variety of reasons and can complicate analyses. By default, these are excluded from this analysis. However, by unchecking the Remove unscheduled visits box, you have the option of including them.
Filters enable you to restrict the analysis to a specific subset of subjects and/or specific visits, based on values within variables. You can also filter based on population flags (Safety is selected by default) within the study data.
If there is a supplemental domain (SUPPxx) associated with your study, you can opt to merge the non-standard data contained therein into your data.
See Select the analysis population, Select saved subject Filter1, Additional Filter to Include Subjects, and Subset of Visits to Analyze for Findings for more information.
Subject-specific filters must be created using the Create Subject Filter report prior to your analysis.