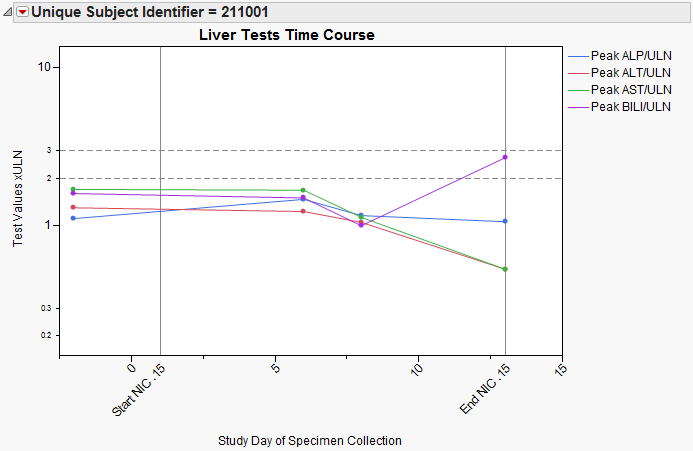
In this example, subject 211001 treated with Nicardipine .15 exhibited higher peak BILI/ULN and lower peak ALT/ULN compared to measurements taken prior to the first dose.
In this example, subject 211001 treated with Nicardipine .15 exhibited higher peak BILI/ULN and lower peak ALT/ULN compared to measurements taken prior to the first dose.