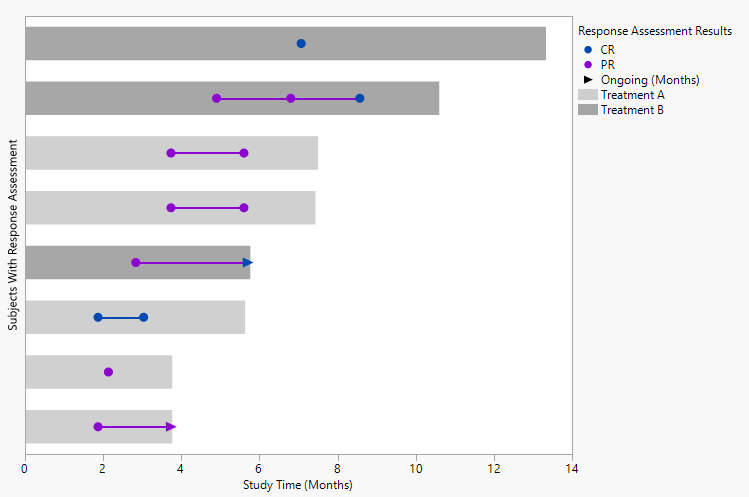
Swimmer Plot A swimmer plot is a graphical way of showing a subject’s response to a treatment over time. It includes a bar for each subject in the study showing the length of treatment duration for each patient, classified by the disease stage at baseline. The plot also includes indicators for the start and end of each response episode, classified by complete or partial response.