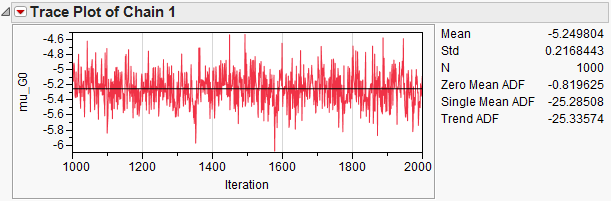
Time Series Graph A time series graph plots the change in observational values over time. See also Action Buttons.