This report fits the multi-level Bayesian hierarchical models of Berry and Berry (2004)1 and Xia, Ma, and Carlin (2011)2. Adverse events are modeled taking into account a grouping variable, such as system organ class.
Running this report for Nicardipine using default settings generates the tabbed Results shown below.
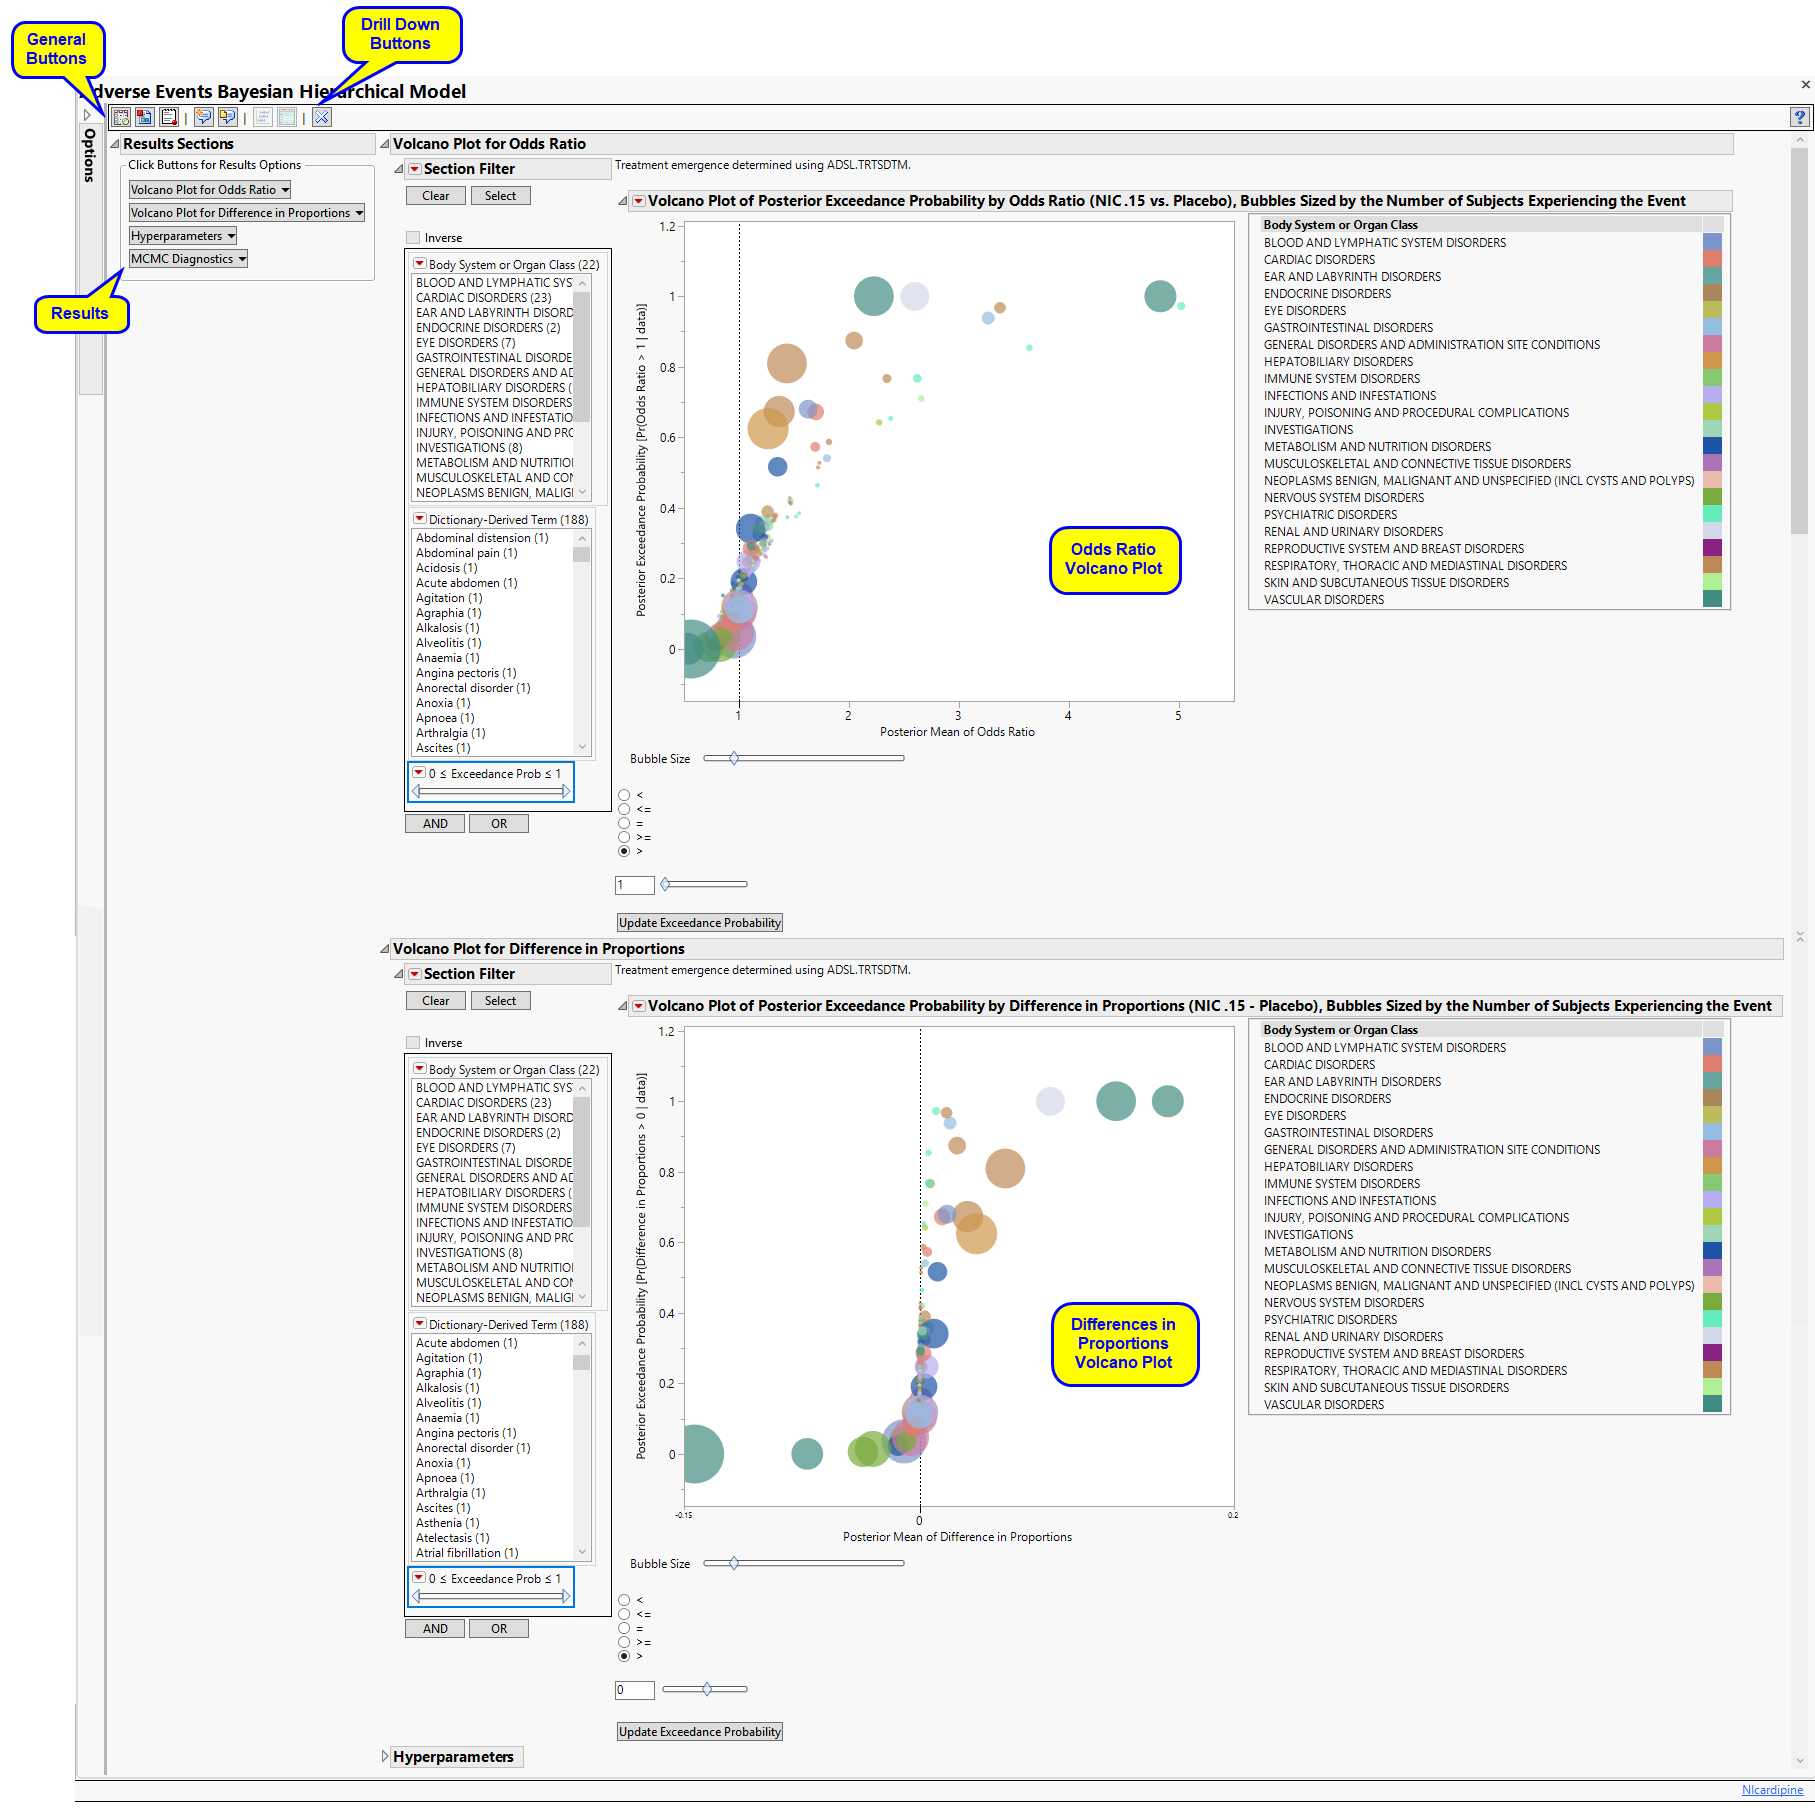
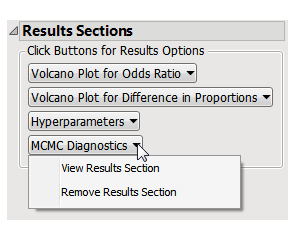
The Results displays the following sections: Results Sections, Volcano Plot for Odds Ratio, Volcano Plot for Difference in Proportions, Hyperparameters, and MCMC Diagnosis.
This pane enables you to access and view the output plots and associated data sets on each tab. Use the drop-down menu to view the section in the Results pane or remove the section and its contents from the Results pane.
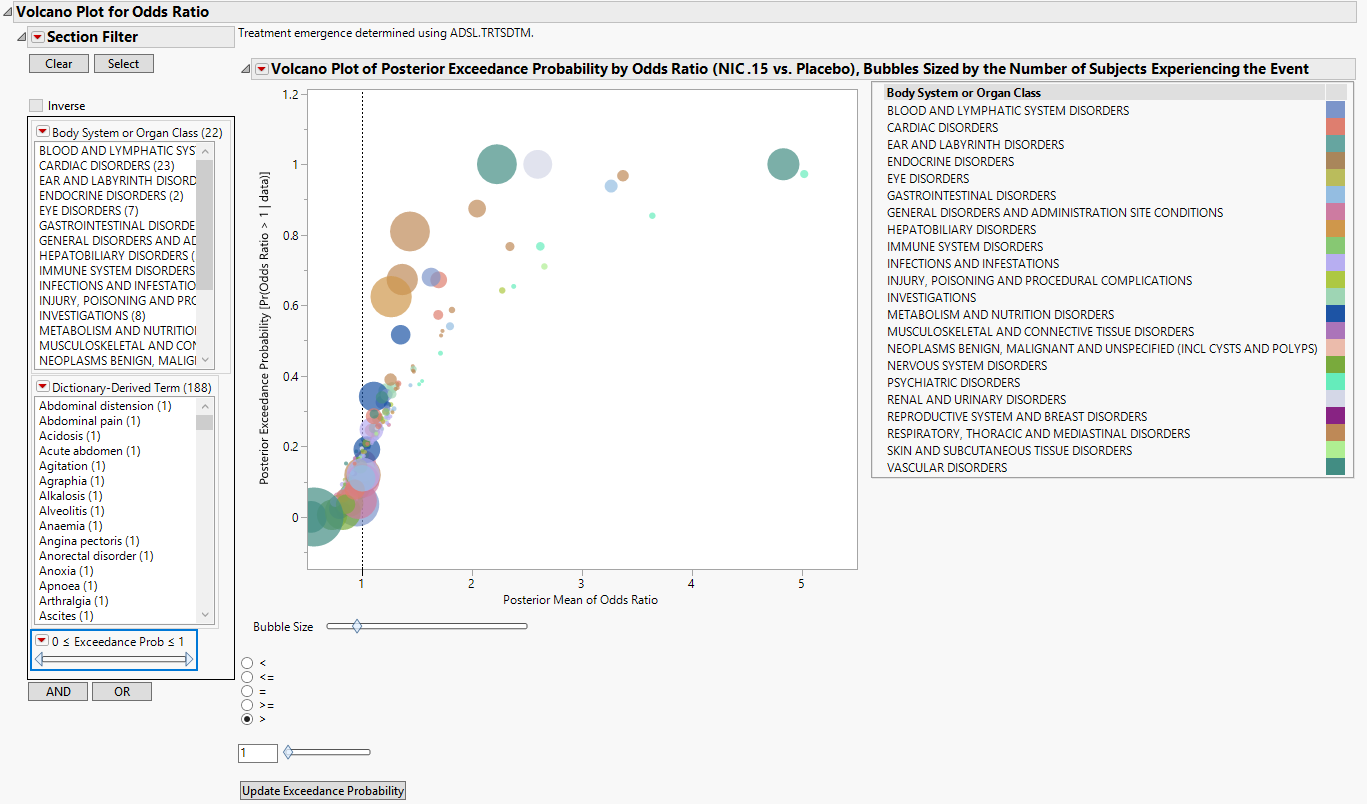
Contains a volcano plot of the posterior exceedance probability by odds ratio sized by the number of subjects experiencing each event.
|
•
|
One Data Filter.
|
Enables you to subset subjects based on body system or organ class, dictionary-derived term, and/or exceedance.. Refer to Data Filter for more information.
|
•
|
One Volcano Plot of Posterior Exceedance Probability by Odds Ratio Sized by the Number of Subjects Experiencing the Event.
|
In this example, markers are colored by Body System or Organ Class, and sized by the number of subjects who experience the event.
Adjust the plot using the Circle Size slider, inequality sign, and exceedance probability. Click to update the plot.
Refer to Volcano Plot for more information about interpreting these plots.

|
•
|
One Data Filter.
|
Enables you to subset subjects based on body system or organ class, dictionary-derived term, and/or exceedance.. Refer to Data Filter for more information.
|
•
|
One Volcano Plot of Posterior Exceedance Probability by Difference in Proportions Sized by the Number of Subjects Experiencing the Event.
|
In this example, markers are colored by Body System or Organ Class, and sized by the number of subjects who experience the event.
Adjust the plot using the Circle Size slider, inequality sign, and exceedance probability. Click to update the plot.
Refer to Volcano Plot for more information about interpreting these plots.

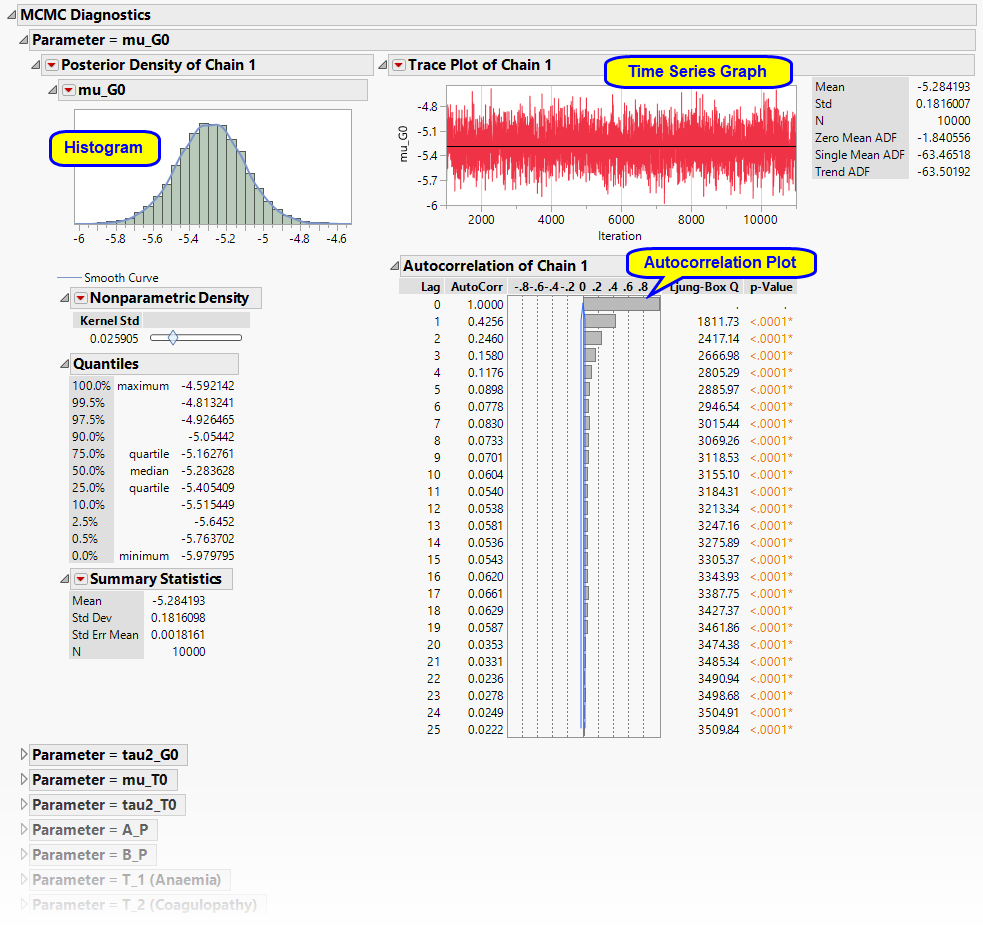
Note: The MCMC Diagnostics section is not shown by default, as it contains a large set of detailed graphs. If you decide to view this section, click on it from the ResultsSection pane, select View Results Section, and allow a few moments for it to load.
|
•
|
|
•
|
|
•
|
One Action Buttons.
|
|
•
|
Forest Plots of Credible Intervals: Select events and click
|
|
•
|
Show Events: Select events and click
|
|
•
|
Click
|
|
•
|
Click
|
|
•
|
Click
|
|
•
|
Click
|
|
•
|
Click the arrow to reopen the completed report dialog used to generate this output.
|
|
•
|
Click the gray border to the left of the Options tab to open a dynamic report navigator that lists all of the reports in the review. Refer to Report Navigator for more information.
|
Note: For information about how treatment emergent adverse events (TEAEs) are defined in JMP Clinical, please refer to How does JMP Clinical determine whether an Event Is a Treatment Emergent Adverse Event?.
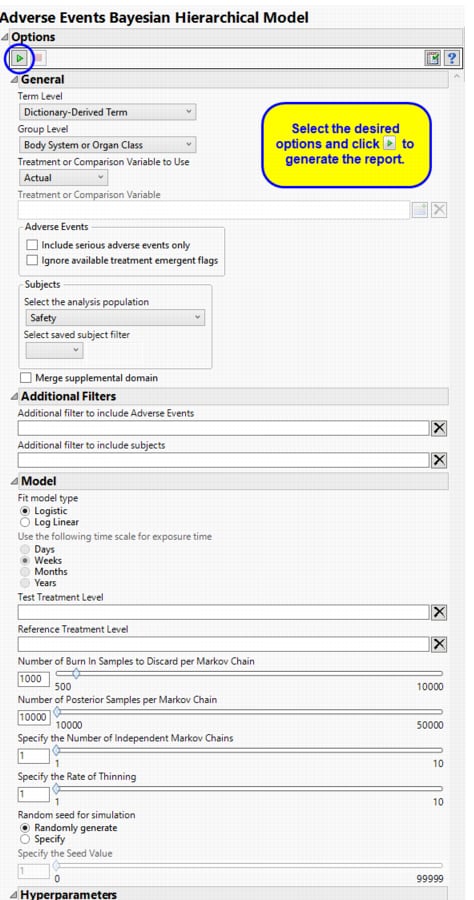
Term and Group Levels are determined by the coding dictionary for the Event or Intervention domain of interest, typically these levels follow the MedDRA dictionary. You must indicate how each adverse event is named and the level at which the event is considered. For example, selecting Reported Term and Body System or Organ Class as the Term Level and Group Level, respectively, reports the event specified by the actual event term as reported in the AE domain on the affected organ or body system.
The primary goal of clinical trials is to distinguish treatment effects when reporting and analyzing trial results. Treatments are defined by specific values in the treatment or comparison variables of the CDISC models. These variables are specified in this report using the Treatment or Comparison Variable to Use andTreatment or Comparison Variable options.
Available variables include Planned, which is selected when the treatments patients received exactly match what was planned and Actual, which is selected when treatment deviates from what was planned.
You can also specify a variable other than the ARM or TRTxxP (planned treatment) or ACTARM or TRTxxA (actual treatment) from the CDISC models as a surrogate variable to serve as a comparator. Finally you can select None to plot the data without segregating it by a treatment variable.
By default, all events are included in the analysis. However, you can opt to include only those considered serious. Selecting the Include serious adverse events only option restricts the analysis to those adverse events defined as Serious under FDA guidelines.
If you choose to Ignore available treatment emergent flags, the analysis includes all adverse events that occur on or after day 1 of the study.
Filters enable you to restrict the analysis to a specific subset of subjects and events based on values within variables. You can also filter based on population flags (Safety is selected by default) within the study data.
If there is a supplemental domain (SUPPAE) associated with your study, you can opt to merge the non-standard data contained therein into your data.
See Select the analysis population, Select saved subject Filter3, Merge supplemental domain, Additional Filter to include Adverse Events, and Additional Filter to Include Subjects, for more information.
Use the Fit model type option to choose whether to model adverse events in a logistic model (Berry and Berry, 20044; Model 1b of Xia, Ma, and Carlin, 20115) or as a log-linear model adjusting for exposure time (Model 2b of Xia, Ma, and Carlin, 2011b) using the Use the following time scale for exposure time.
Test Treatment Level, Reference Treatment Level
Number of Burn In Samples to Discard per Markov Chain, Number of Posterior Samples per Markov Chain
Specify the Number of Independent Markov Chains, Specify the Rate of Thinning
A seed value is a nonnegative integer used to start the simulation. You can opt to use a Random seed for simulation or to Specify the Seed Value. You should note that if you choose a random seed to start the simulation, the results you get from run to run are likely to be different. You should specify a seed to generate consistent results.
Xia, H.A., Ma, H., and Carlin, B.P. (2011). Bayesian Hierarchical Modeling for Detecting Safety Signals in Clinical Trials. Journal of Biopharmaceutical Statistics 21, 1006-1029.
Subject-specific filters must be created using the Create Subject Filter report prior to your analysis.
Xia, H.A., Ma, H., and Carlin, B.P. (2011). Bayesian Hierarchical Modeling for Detecting Safety Signals in Clinical Trials. Journal of Biopharmaceutical Statistics 21, 1006-1029.