Note: JMP Clinical uses a special protocol for data including non-unique Findings test names. Refer to How does JMP Clinical handle non-unique Findings test names? for more information.
Running this report with the Nicardipine sample setting generates the report shown below.
The Report contains the following elements:
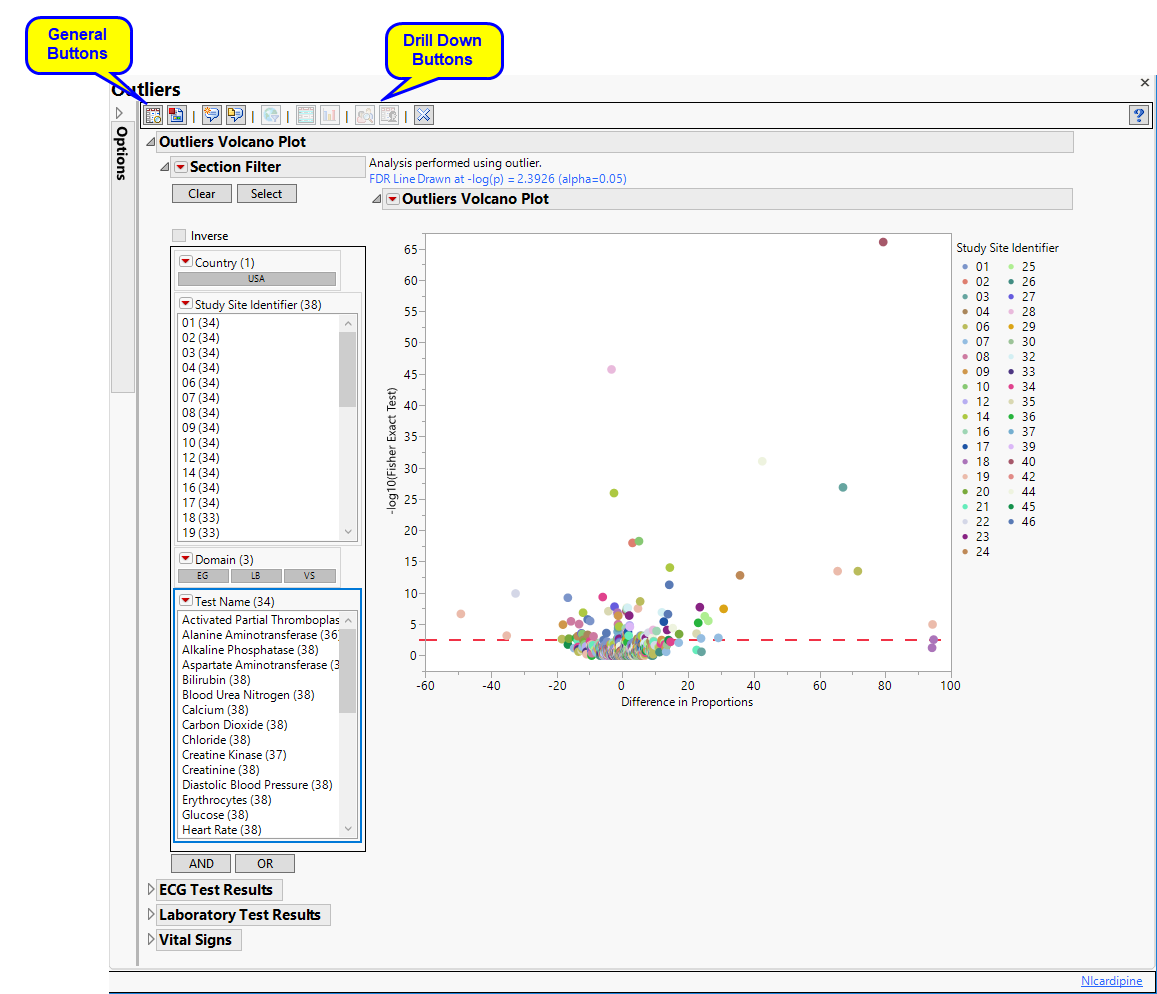
Shows a volcano plot used to determine the deviation of the proportion of outliers at each study site with the overall proportions for the whole study. The X axis is calculated using p(site) - p(reference), where p(site) is the proportion (or percent) of outliers in the site in question and p(reference) is the proportion of outliers in all other sites.
|
•
|
One Data Filter.
|
Enables you to subset subjects based on country of origin, study site and/or Test. Refer to Data Filter for more information.
|
•
|
One Volcano Plot.
|
The volcano plot is used to determine the deviation in the proportion of outliers at each site from the proportion of outliers at all of the other sites. The X axis represents the difference in proportions for measurements that are considered outliers between the site and the reference set (all other sites).in the proportion of outliers at each site from the average proportion at all of the other sites.
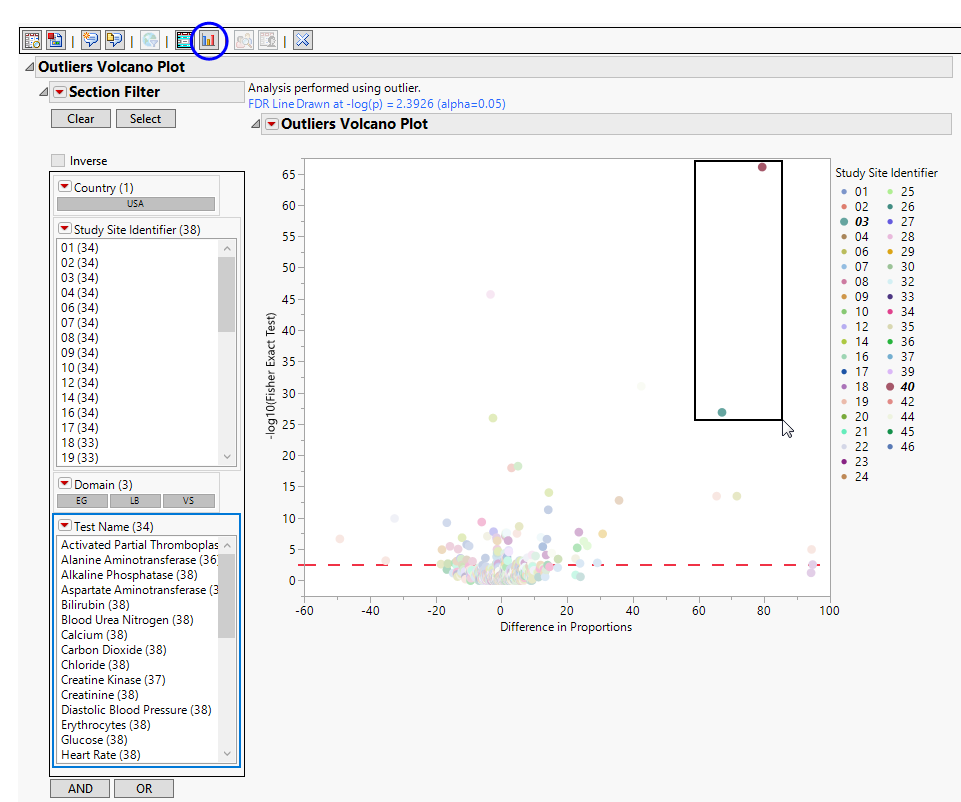
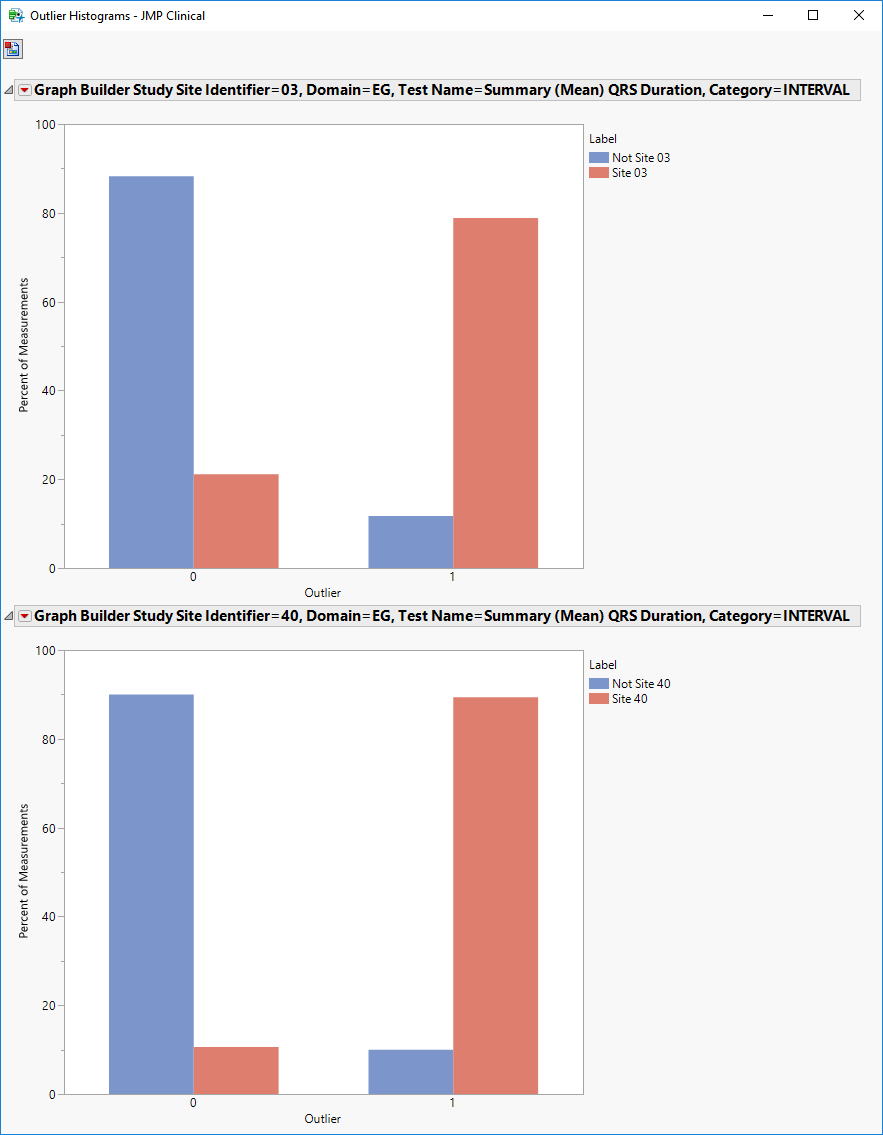
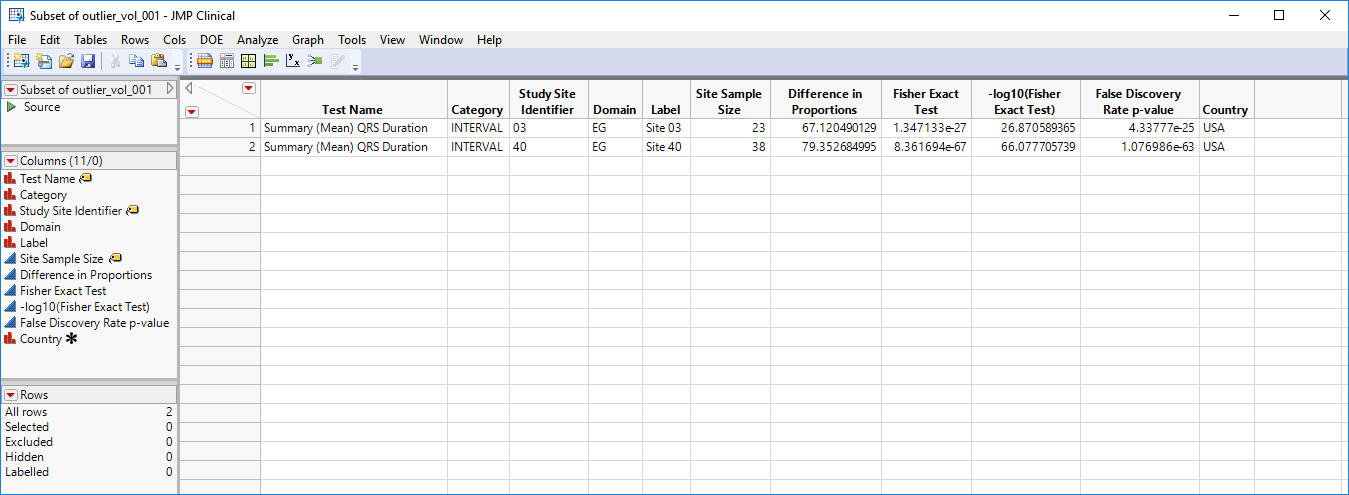
You can mouse over points of interest to see their labels or select points by dragging a mouse rectangle over them (as shown above). Selected rows are highlighted in other plots and you can also then click on various Down Buttons for further analyses on those specific sites. For example, if you click the Outlier Bar Charts ( ) drill down (circled above), the following opens with comparisons of sites 3 and 40 with all sites not site 3 or 40, respectively.
|
•
|
Data Filter: Enables you to filter data based on study site and country.
|
|
•
|
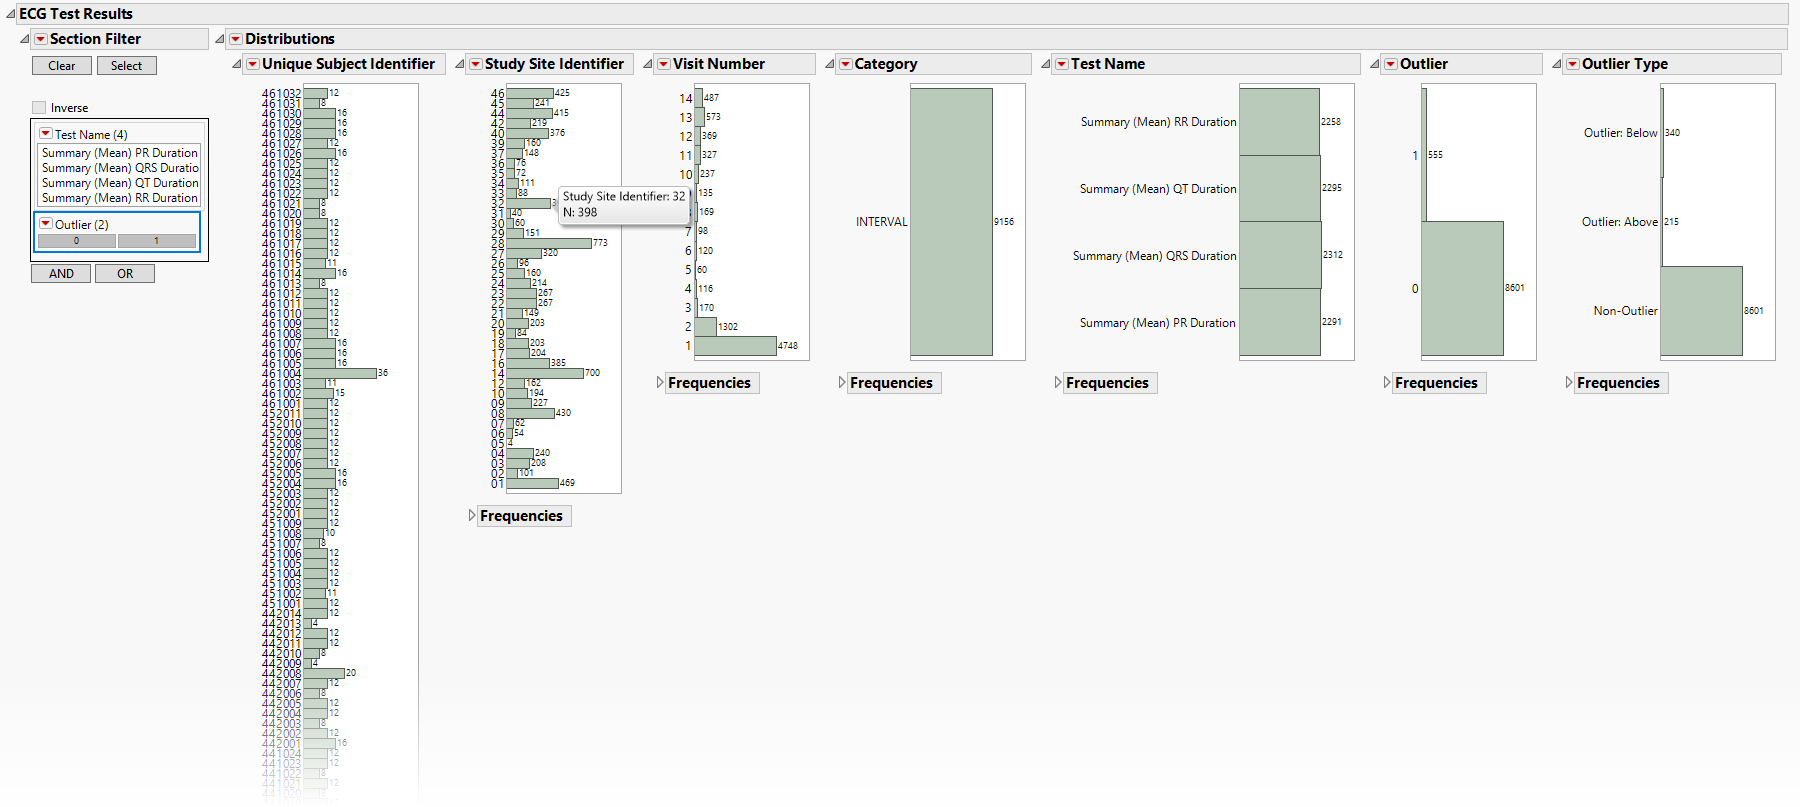
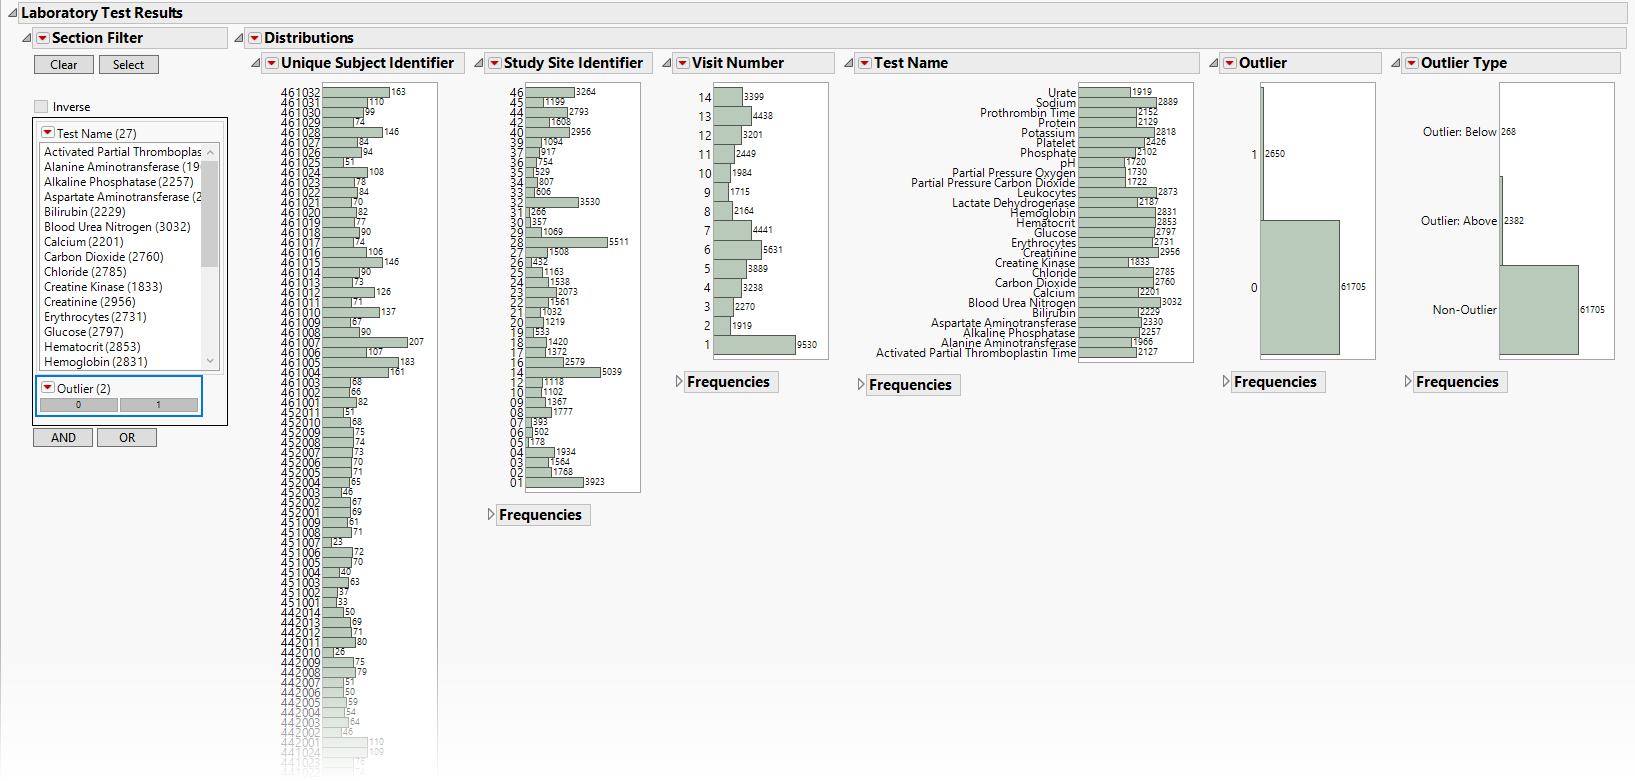
Distributions: Displays histograms showing distribution of ECG findings across study sites, tests, and visit numbers, study sites, categories and tests. The last two histograms show the relative proportion of outliers and whether they are outliers because the value is too high (Outlier: Above) or small (Outlier: Below). Clicking Show Subjects will open a data table that will show the range of non-outlier values (Lower and Upper Outlier Limits).
|
|
•
|
Data Filter: Enables you to filter data based on study site and country.
|
|
•
|
Distributions: Displays histograms showing distribution of LB findings across study sites, tests, and visit numbers, study sites, categories, and tests. The last two histograms show the relative proportion of outliers and whether are outliers because the value is too high (Outlier: Above) or small (Outlier: Below). Clicking Show Subjects will open a data table that will show the range of non-outlier values (Lower and Upper Outlier Limits).
|
|
•
|
Data Filter: Enables you to filter data based on study site and country.
|
|
•
|
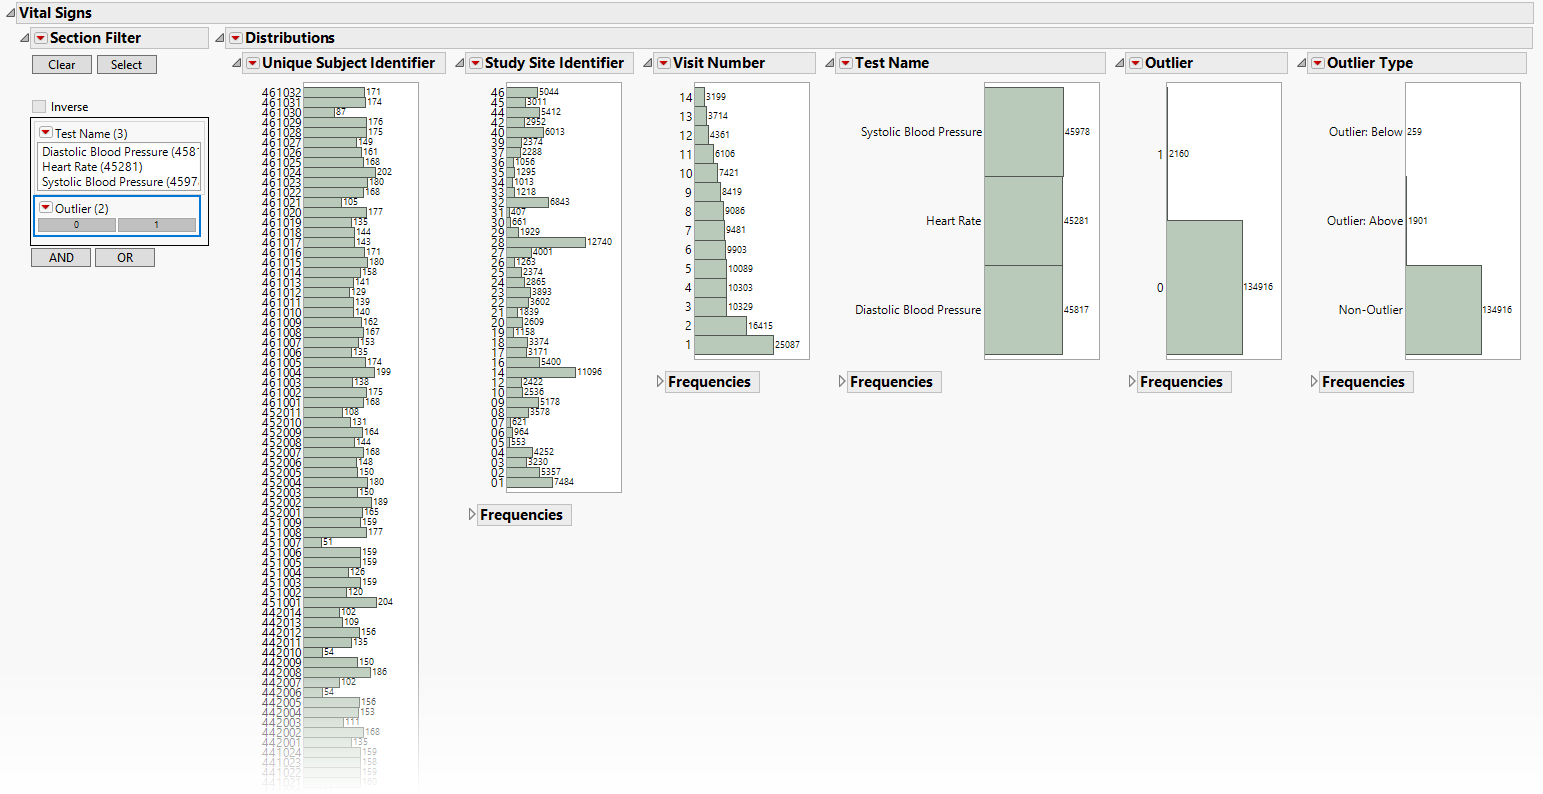
Distributions: Displays histograms showing distribution of VS findings across study sites, tests, and visit numbers, study sites, categories, and tests. The last two histograms show the relative proportion of outliers and whether are outliers because the value is too high (Outlier: Above) or small (Outlier: Below). Clicking Show Subjects will open a data table that will show the range of non-outlier values (Lower and Upper Outlier Limits).
|
|
•
|
Show Sites: Shows the rows of the data table for the selected points from the volcano plot. Clicking
|
|
•
|
Frequencies Bar Charts: Select points on the volcano plot and click
|
|
•
|
Profile Subjects: Select subjects and click
|
|
•
|
Show Subjects: Select subjects and click
|
|
•
|
Click
|
|
•
|
Click
|
|
•
|
Click
|
|
•
|
Click
|
|
•
|
Click the arrow to reopen the completed report dialog used to generate this output.
|
|
•
|
Click the gray border to the left of the Options tab to open a dynamic report navigator that lists all of the reports in the review. Refer to Report Navigator for more information.
|
This report compares the outlier status of tests with each site compared to all other sites taken together as a reference. A point is an outlier if it exceeds the upper outlier limit (Q3+1.5×IQR) or is less than the lower outlier limit (Q1-1.5×IQR), where Q1 and Q3 are first and third quartiles and IQR =Q3-Q1. It then compares the rate of outliers using Fisher's exact test. FDR p-values are calculated and the reference line is determined as described in How does JMP Clinical calculate the False Discovery Rate (FDR)?.
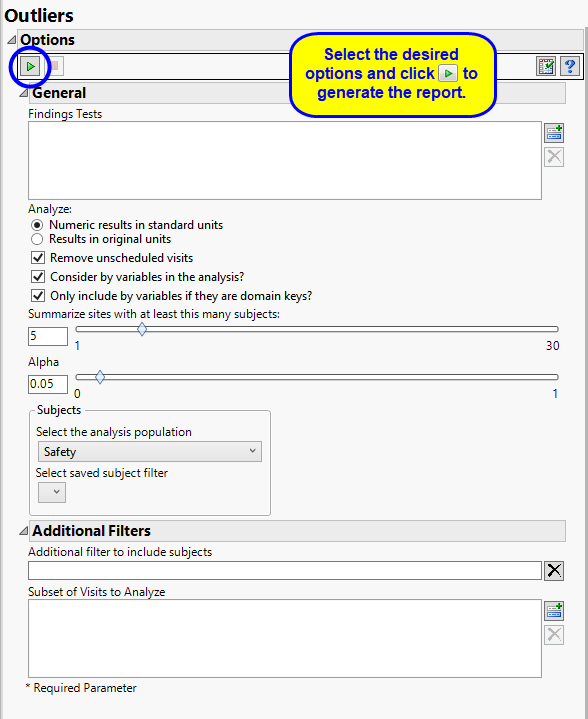
By default the report is set to analyze all tests from all findings domains. You can opt however, to restrict the search to specific Findings Tests.
You can specify whether to search all results in original units when you Analyze: the data or restrict the search to either character results (in standard format) or numeric results (in standard units).
Unscheduled visits can occur for a variety of reasons. By default, these are excluded from this analysis. However, by unchecking the Remove unscheduled visits box, you have the option of including them.
You can opt to Consider BY variables in the analysis. This option, which assumes that BY variables (left vs. right arm for collecting blood pressure data, for example) are included in the experimental design, is selected by default. You can uncheck this option to ignore BY variables.
Use the Only include BY variables if they are domain keys option to subset the available variables to only include those variables that are domain keys. If the option is unchecked, the report uses the cross-classification of xxCAT, xxSCAT, xxLOC, xxMETHOD, xxPOS, xxSPEC, and xxTPT for creating by groups for all variables that are available (as it had in the past).
The Summarize sites with at least this many subjects: option enables you to set a minimal threshold for the sites to be analyzed. Only those sites which exceed the specified number of subjects are included. This feature is useful because it enables you to exclude smaller sites, where small differences due to random events are more likely to appear more significant than they truly are. In larger sites, observed differences from expected attendance due to random events are more likely to be significant because any deviations due to random events are less likely to be observed.
The Alpha option is used to specify the significance level by which to judge the validity of the outliers revealed by this report. The meaning of alpha depends on the adjustment method that you select. Alpha can be set to any number between 0 and 1, but is most typically set at 0.001, 0.01, 0.05, or 0.10. The higher the alpha, the higher the error rate but also higher the power for detecting significant differences. You will need to decide on the best trade-off for your experiment.
Filters enable you to restrict the analysis to a specific subset of subjects and/or adverse events, based on values within variables. You can also filter based on population flags (Safety is selected by default) within the study data.
See Select the analysis population, Select saved subject Filter2, and Additional Filter to Include Subjects
The Subset of Visits to Analyze options enables you to restrict to a specific subset of visits.
Where xx is the two-letter domain name.
Subject-specific filters must be created using the Create Subject Filter report prior to your analysis.