FDR p-values are calculated and the reference line is determined as described in How does JMP Clinical calculate the False Discovery Rate (FDR)?.
Note: JMP Clinical uses a special protocol for data including non-unique Findings test names. Refer to How does JMP Clinical handle non-unique Findings test names? for more information.
Note: xxTPT should not have any visit-specific information in it, or it is liable to prevent a match using BY variables.

The Report contains the following elements:
|
•
|
One Data Filter.
|
Enables you to subset subjects based on country of origin, study site and/or Test. Refer to Data Filter for more information.
|
•
|
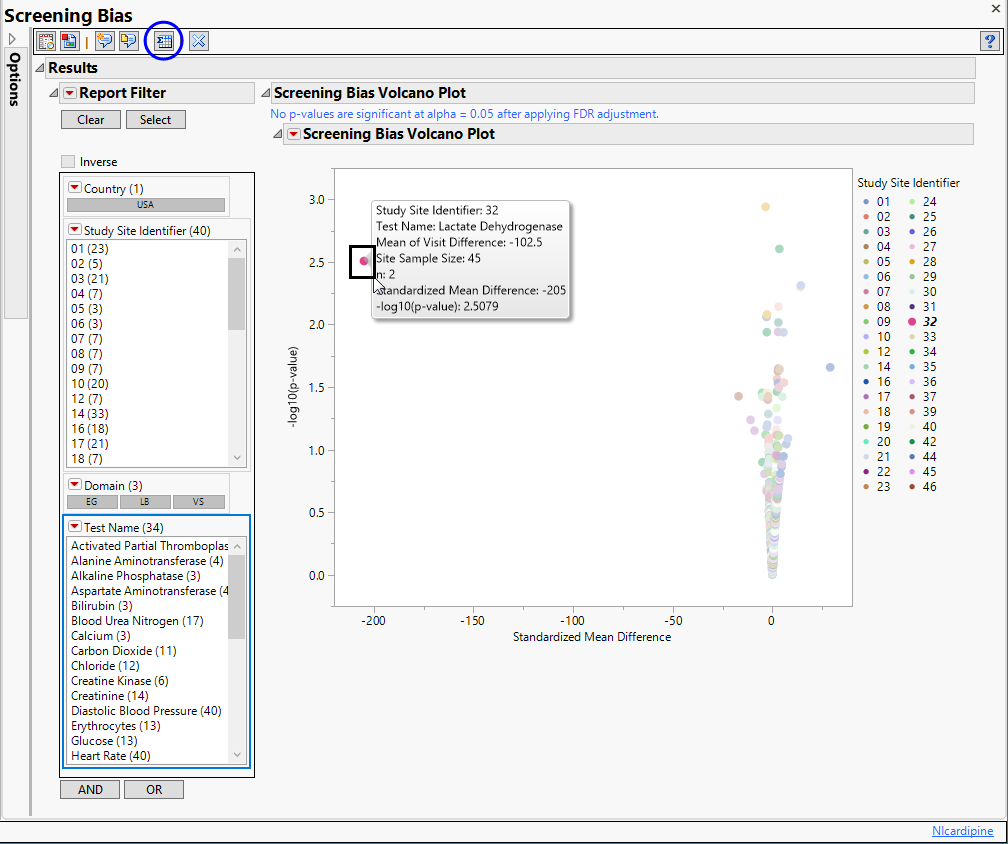
One Volcano Plot. Shows a volcano plot used to find records where findings change significantly between one visit and the next. Screening bias compares all numerical variables. These ranges can be quite different from one another, so to summarize all of the variables in one plot, they are centered around 0 and scaled on the X axis using the standardized mean difference, which is:
 |
This is the paired t-statistic which has n-1 degrees of freedom. When n is fixed, as it should be for all measurements coming from a site (unless there are missing data), all tests should have n measurements.
Screening Bias generates a number of paired t-test statistics, one for each Findings test for a specific site. These become significant as we depart from 0. Sets of values seem to have smooth curves here because the deviation from zero slows down as the difference gets larger and larger.
Each point represents a single Findings test for a specific site. You can mouse over points of interest to see their labels or select points by dragging a mouse rectangle over them (as shown above). Selected rows are highlighted in other plots and you can also then click on various Down Buttons for further analyses on those specific sites.

A very large Visit 1 - Visit 2 difference (increase) has been identified for lactate dehydrogenase for site 32. Visit 1 mean = 338.5 Visit 2 mean = 441 with Mean of V1 minus V2 Differences = -102.5. So there is an increase of 102.5 units which divided by the standard error gives a standardized difference of -205. This is a large change considering the observed variability and suggests further investigation.
|
•
|
Show Summary Statistics: Shows the rows of the data table for the selected points from the volcano plot (see above).
|
|
•
|
Click
|
|
•
|
Click
|
|
•
|
Click
|
|
•
|
Click
|
|
•
|
Click the arrow to reopen the completed report dialog used to generate this output.
|
|
•
|
Click the gray border to the left of the Options tab to open a dynamic report navigator that lists all of the reports in the review. Refer to Report Navigator for more information.
|
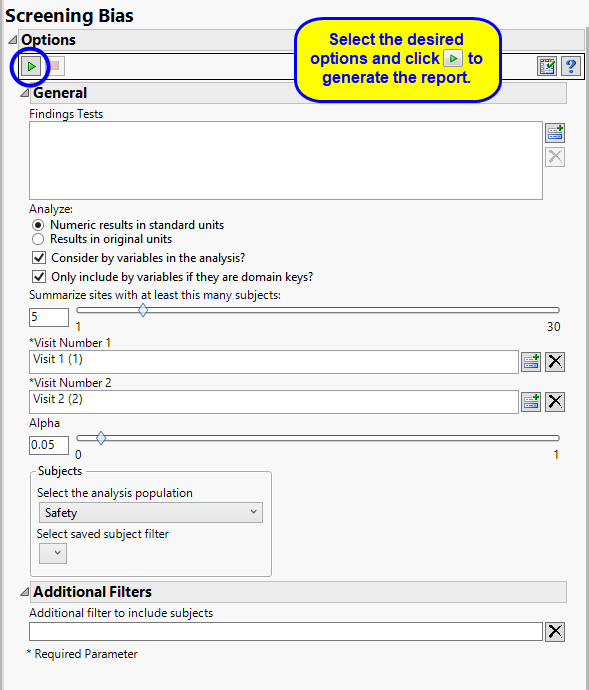
By default the report is set to analyze all tests from all findings domains. You can opt however, to restrict the search to specific Findings Tests.
You can specify whether to search all results in original units when you Analyze: the data or restrict the search to either character results (in standard format) or numeric results (in standard units).
You can opt to Consider BY variables in the analysis. This option, which assumes that BY variables (left vs. right arm for collecting blood pressure data, for example) are included in the experimental design, is selected by default. You can uncheck this option to ignore BY variables.
Use the Only include BY variables if they are domain keys option to subset the available variables to only include those variables that are domain keys. If the option is unchecked, the report uses the cross-classification of xxCAT, xxSCAT, xxLOC, xxMETHOD, xxPOS, xxSPEC, and xxTPT for creating by groups for all variables that are available (as it had in the past).
The Summarize sites with at least this many subjects: option enables you to set a minimal threshold for the sites to be analyzed. Only those sites which exceed the specified number of subjects are included. This feature is useful because it enables you to exclude smaller sites, where small differences due to random events are more likely to appear more significant than they truly are. In larger sites, observed differences from expected attendance due to random events are more likely to be significant because any deviations due to random events are less likely to be observed.
You must specify the two visits to use for calculating differences that are used for determining bias. While the first two visits in the study are specified as Visit Number 1 and Visit Number 2, respectively, by default, you can select any pair of visits.
The Alpha option is used to specify the significance level by which to judge the validity of the outliers revealed by this report. The meaning of alpha depends on the adjustment method that you select. Alpha can be set to any number between 0 and 1, but is most typically set at 0.001, 0.01, 0.05, or 0.10. The higher the alpha, the higher the error rate but also higher the power for detecting significant differences. You will need to decide on the best trade-off for your experiment.
Filters enable you to restrict the analysis to a specific subset of subjects and/or adverse events, based on values within variables. You can also filter based on population flags (Safety is selected by default) within the study data.
See Select the analysis population, Select saved subject Filter1, and Additional Filter to Include Subjects
Subject-specific filters must be created using the Create Subject Filter report prior to your analysis.