Note: JMP Clinical uses a special protocol for data including non-unique Findings test names. Refer to How does JMP Clinical handle non-unique Findings test names? for more information.
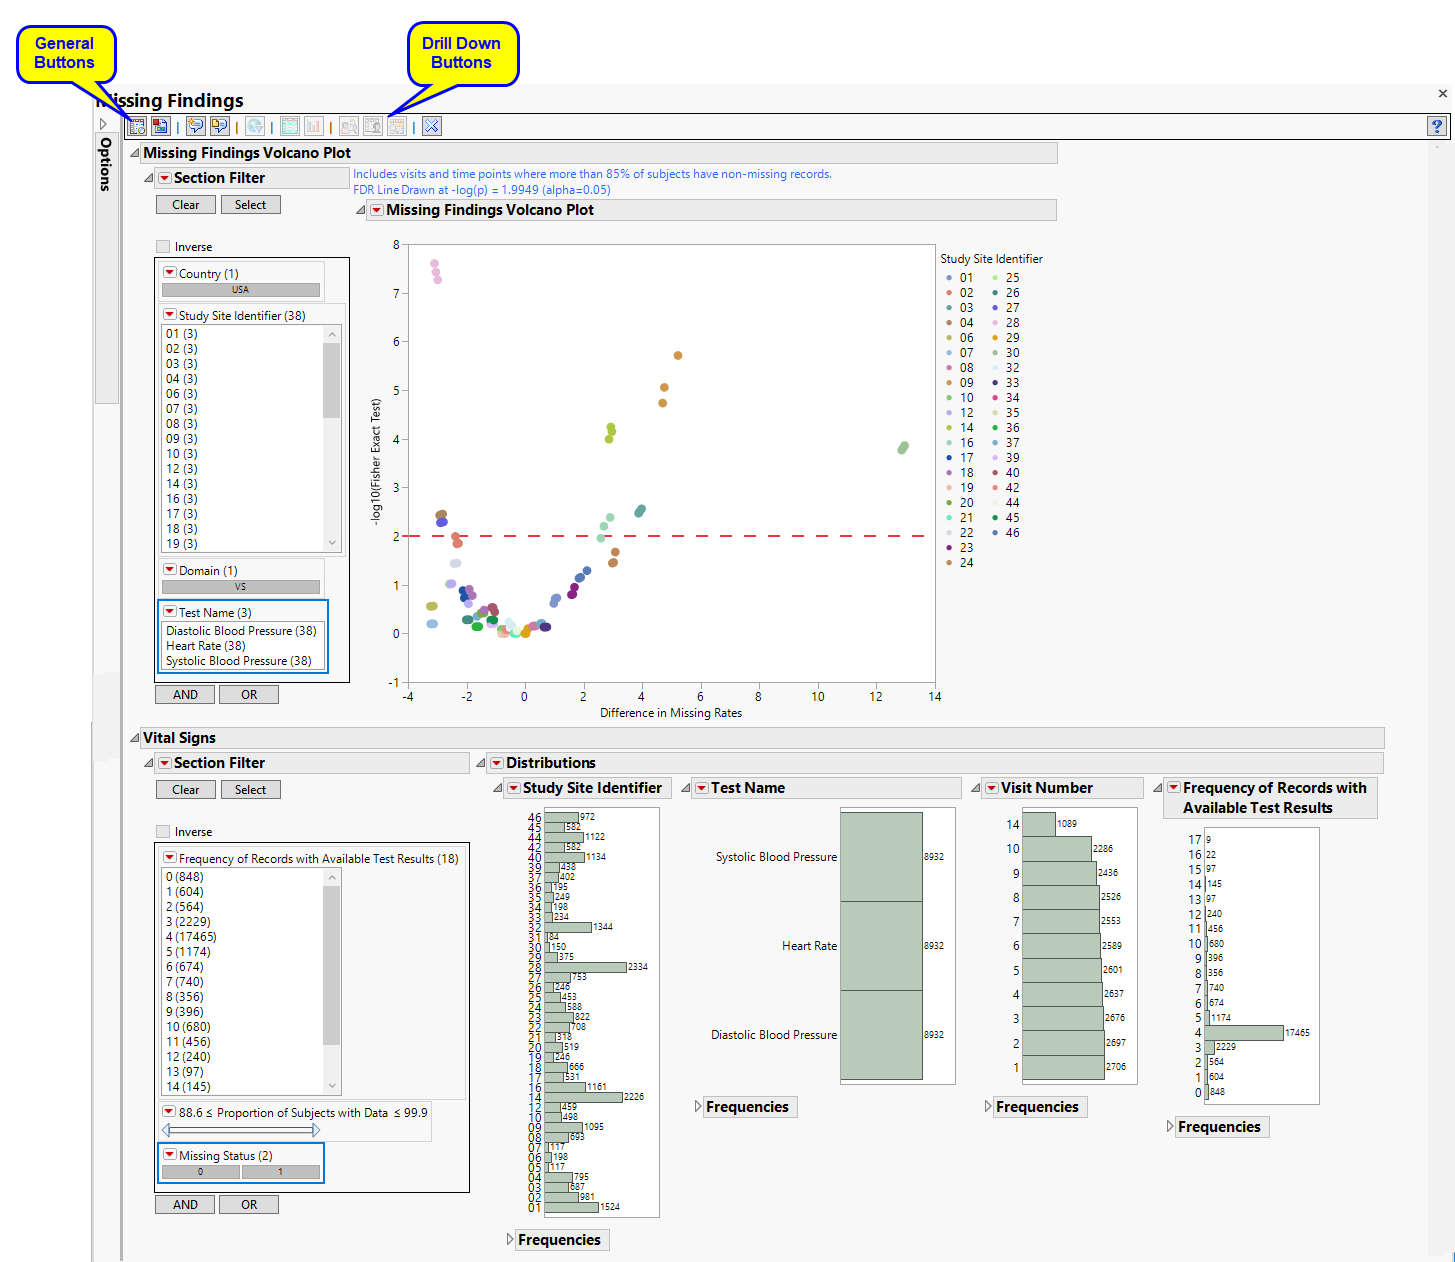
Running Missing Findings for the Nicardipine study using default settings generates the report shown below:
|
•
|
One Data Filter.
|
Enables you to subset subjects based on country of origin, study site and/or Test. Refer to Data Filter for more information.
|
•
|
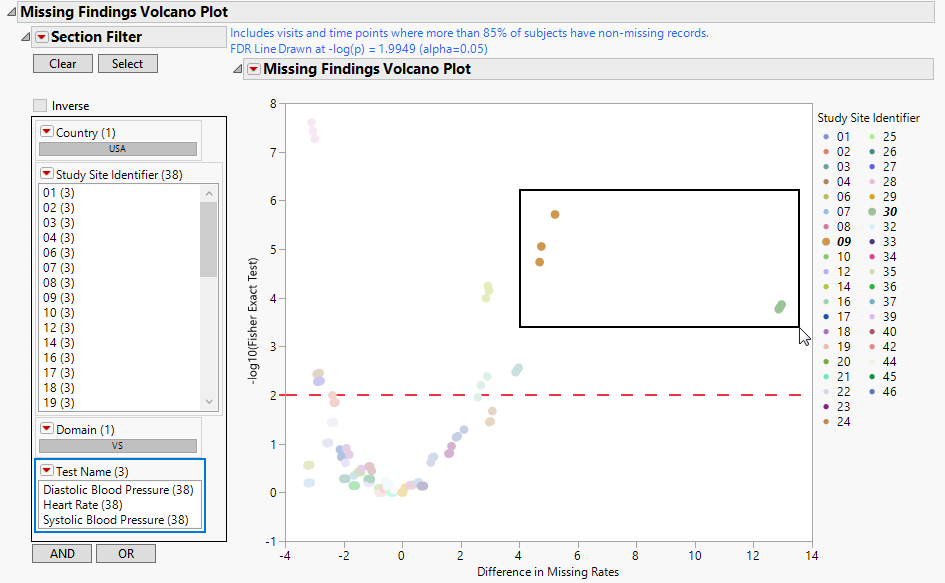
One Volcano Plot.
|
You can mouse over points of interest to see their labels or select points by dragging a mouse rectangle over them (as shown above). Selected Findings tests are highlighted in other plots and you can also then click on various Drill Down Buttons for further analyses on those specific sites.
See Volcano Plot for more information.
Note: This test is usually not performed at every visit and so is normally not considered in this analysis. This section is not generated in the Nicardipine example. Refer to the ECG Test Results for one of the other reports (such as Frequencies, for example) for more information.
Note: This test is usually not performed at every visit, and so is normally not considered in this analysis. This section is not generated in the Nicardipine example. Refer to the Laboratory Test Results for one of the other reports (such as Frequencies, for example) for more information.
|
•
|
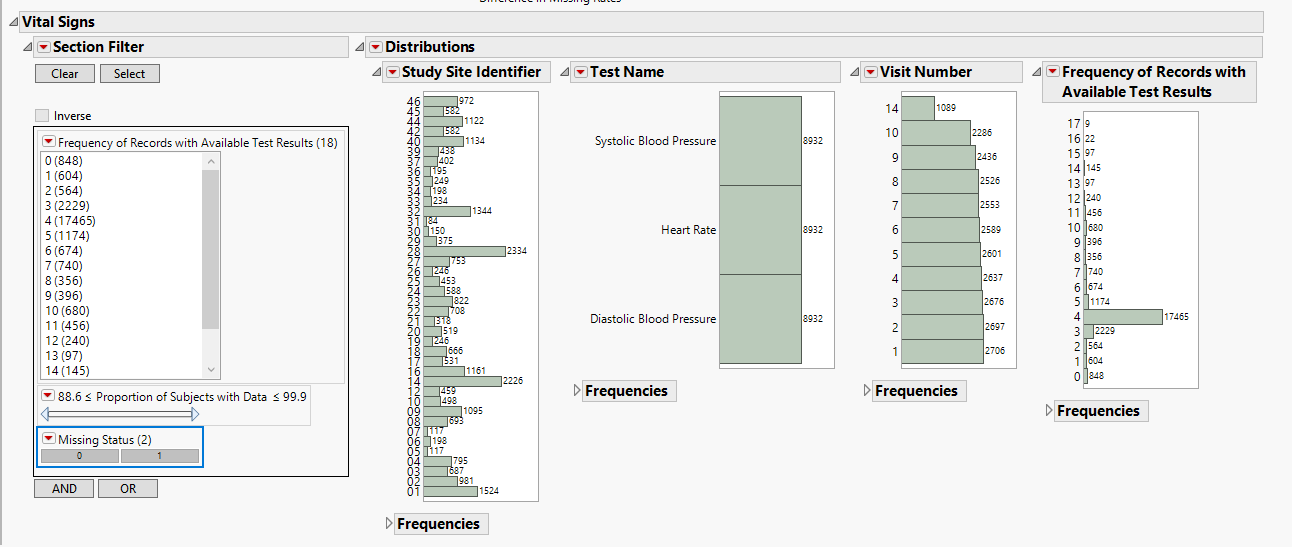
Data Filter: Enables you to filter data based on study site and country.
|
|
•
|
Distributions: Displays histograms showing distribution of vital signs findings across study sites, tests, and visit numbers,
|
|
•
|
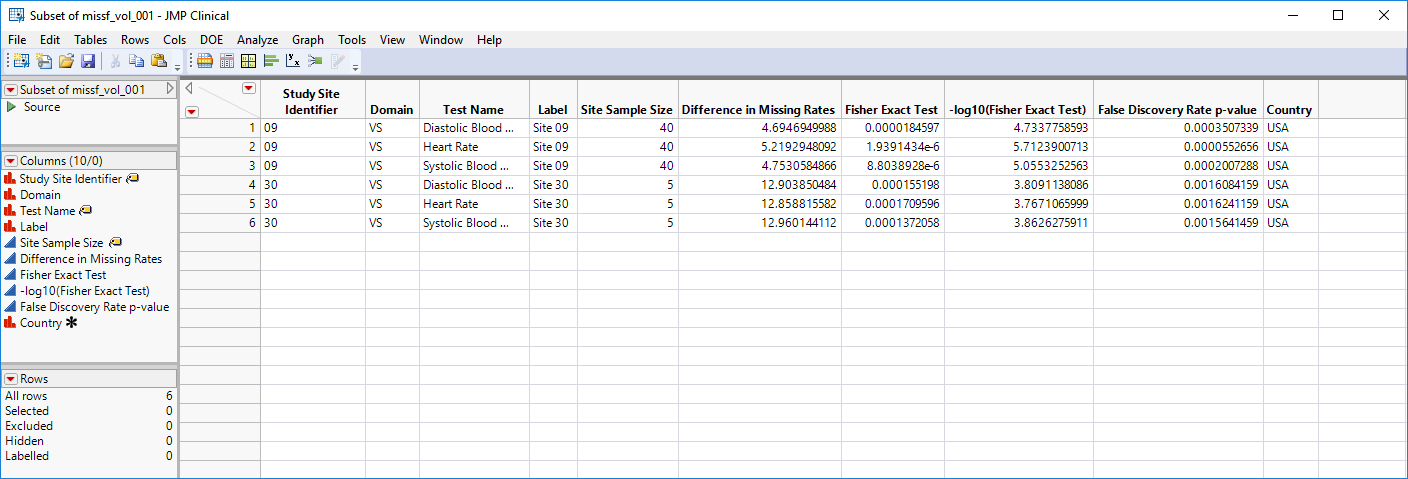
Show Sites: Shows the rows of the data table for the selected points from the volcano plot. Clicking
|
|
•
|
Missing Bar Charts: Select points on the volcano plot and click
|
|
•
|
Profile Subjects: Select subjects and click
|
|
•
|
Show Subjects: Select subjects and click
|
|
•
|
Show Records with Missing Test Results: Select one or more histograms and click
|
|
•
|
Click
|
|
•
|
Click
|
|
•
|
Click
|
|
•
|
Click
|
|
•
|
Click the arrow to reopen the completed report dialog used to generate this output.
|
|
•
|
Click the gray border to the left of the Options tab to open a dynamic report navigator that lists all of the reports in the review. Refer to Report Navigator for more information.
|
This report determines whether tests are expected or not at each visit according to dialog option (default 85%). If 85% of patients at a particular visit and/or time point have a test measured, this test is expected (assuming that the subjects have had the opportunity to attend this visit). Among expected tests and for each test, the proportion of “missingness” is calculated for each site (the suspect site, indexed with s) compared to all other sites taken together as a reference (indexed as o) using a Fisher's exact test. FDR p-values are calculated and the reference line is determined as described in How does JMP Clinical calculate the False Discovery Rate (FDR)?.
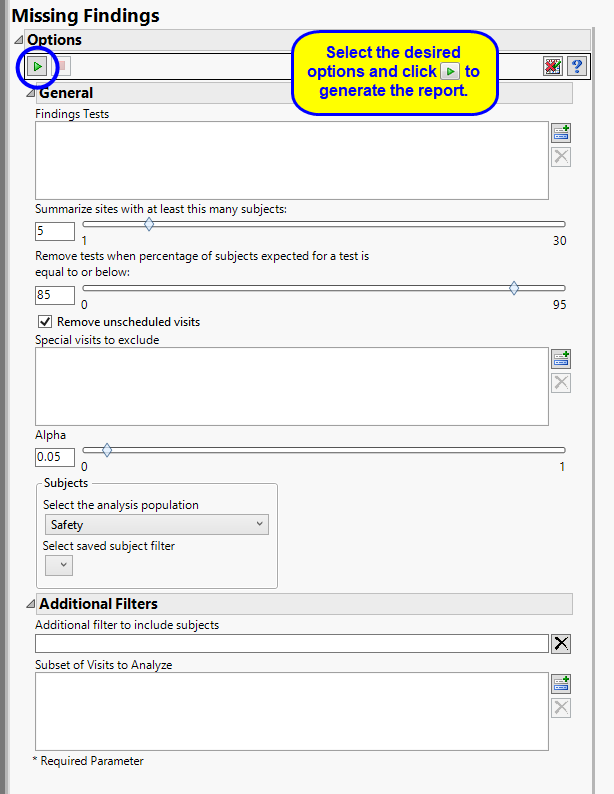
By default the report is set to Analyze all tests from all findings domains. You can opt however, to restrict the search to specific Findings Tests.
The Summarize sites with at least this many subjects: option enables you to set a minimal threshold for the sites to be analyzed. Only those sites which exceed the specified number of subjects are included. This feature is useful because it enables you to exclude smaller sites, where small differences due to random events are more likely to appear more significant than they truly are. In larger sites, observed differences from expected attendance due to random events are more likely to be significant because any deviations due to random events are less likely to be observed.
By default, findings analyses are conducted assuming that sufficient numbers of subjects have participated to make the results statistically significant. As a result, all test results, including missing results, are included in findings analyses. However, findings can be skewed when the percentage of missing results is greater than expected. For these cases, you should use the Remove tests when percentage of subjects expected for a test is equal to or below: option to specify a minimal participation threshold. Tests not meeting this threshold are excluded from the analysis.
By default, all patient visits are included in the analysis. TheRemove unscheduled visits option enables you to restrict the analysis to scheduled visits only. You should also indicate whether there are visits (marked by Special visits to exclude) that should be excluded.
The Alpha option is used to specify the significance level by which to judge the validity of the missing findings data generated by this report. The meaning of alpha depends on the adjustment method that you select. Alpha can be set to any number between 0 and 1, but is most typically set at 0.001, 0.01, 0.05, or 0.10. The higher the alpha, the higher the error rate but also higher the power for detecting significant differences. You will need to decide on the best trade-off for your experiment.
Filters enable you to restrict the analysis to a specific subset of subjects and/or adverse events, based on values within variables. You can also filter based on population flags (Safety is selected by default) within the study data.
See Select the analysis population, Select saved subject Filter1, and Additional Filter to Include Subjects
The Subset of Visits to Analyze options enables you to restrict to a specific subset of visits.
Subject-specific filters must be created using the Create Subject Filter report prior to your analysis.