The Interventions Distribution report compares distributions of interventions (either concomitant medication or substance use) and demographic variables across treatment arms.
Note: Refer to Distribution Reports for a description of the general analysis performed by the JMP Clinical distribution reports.
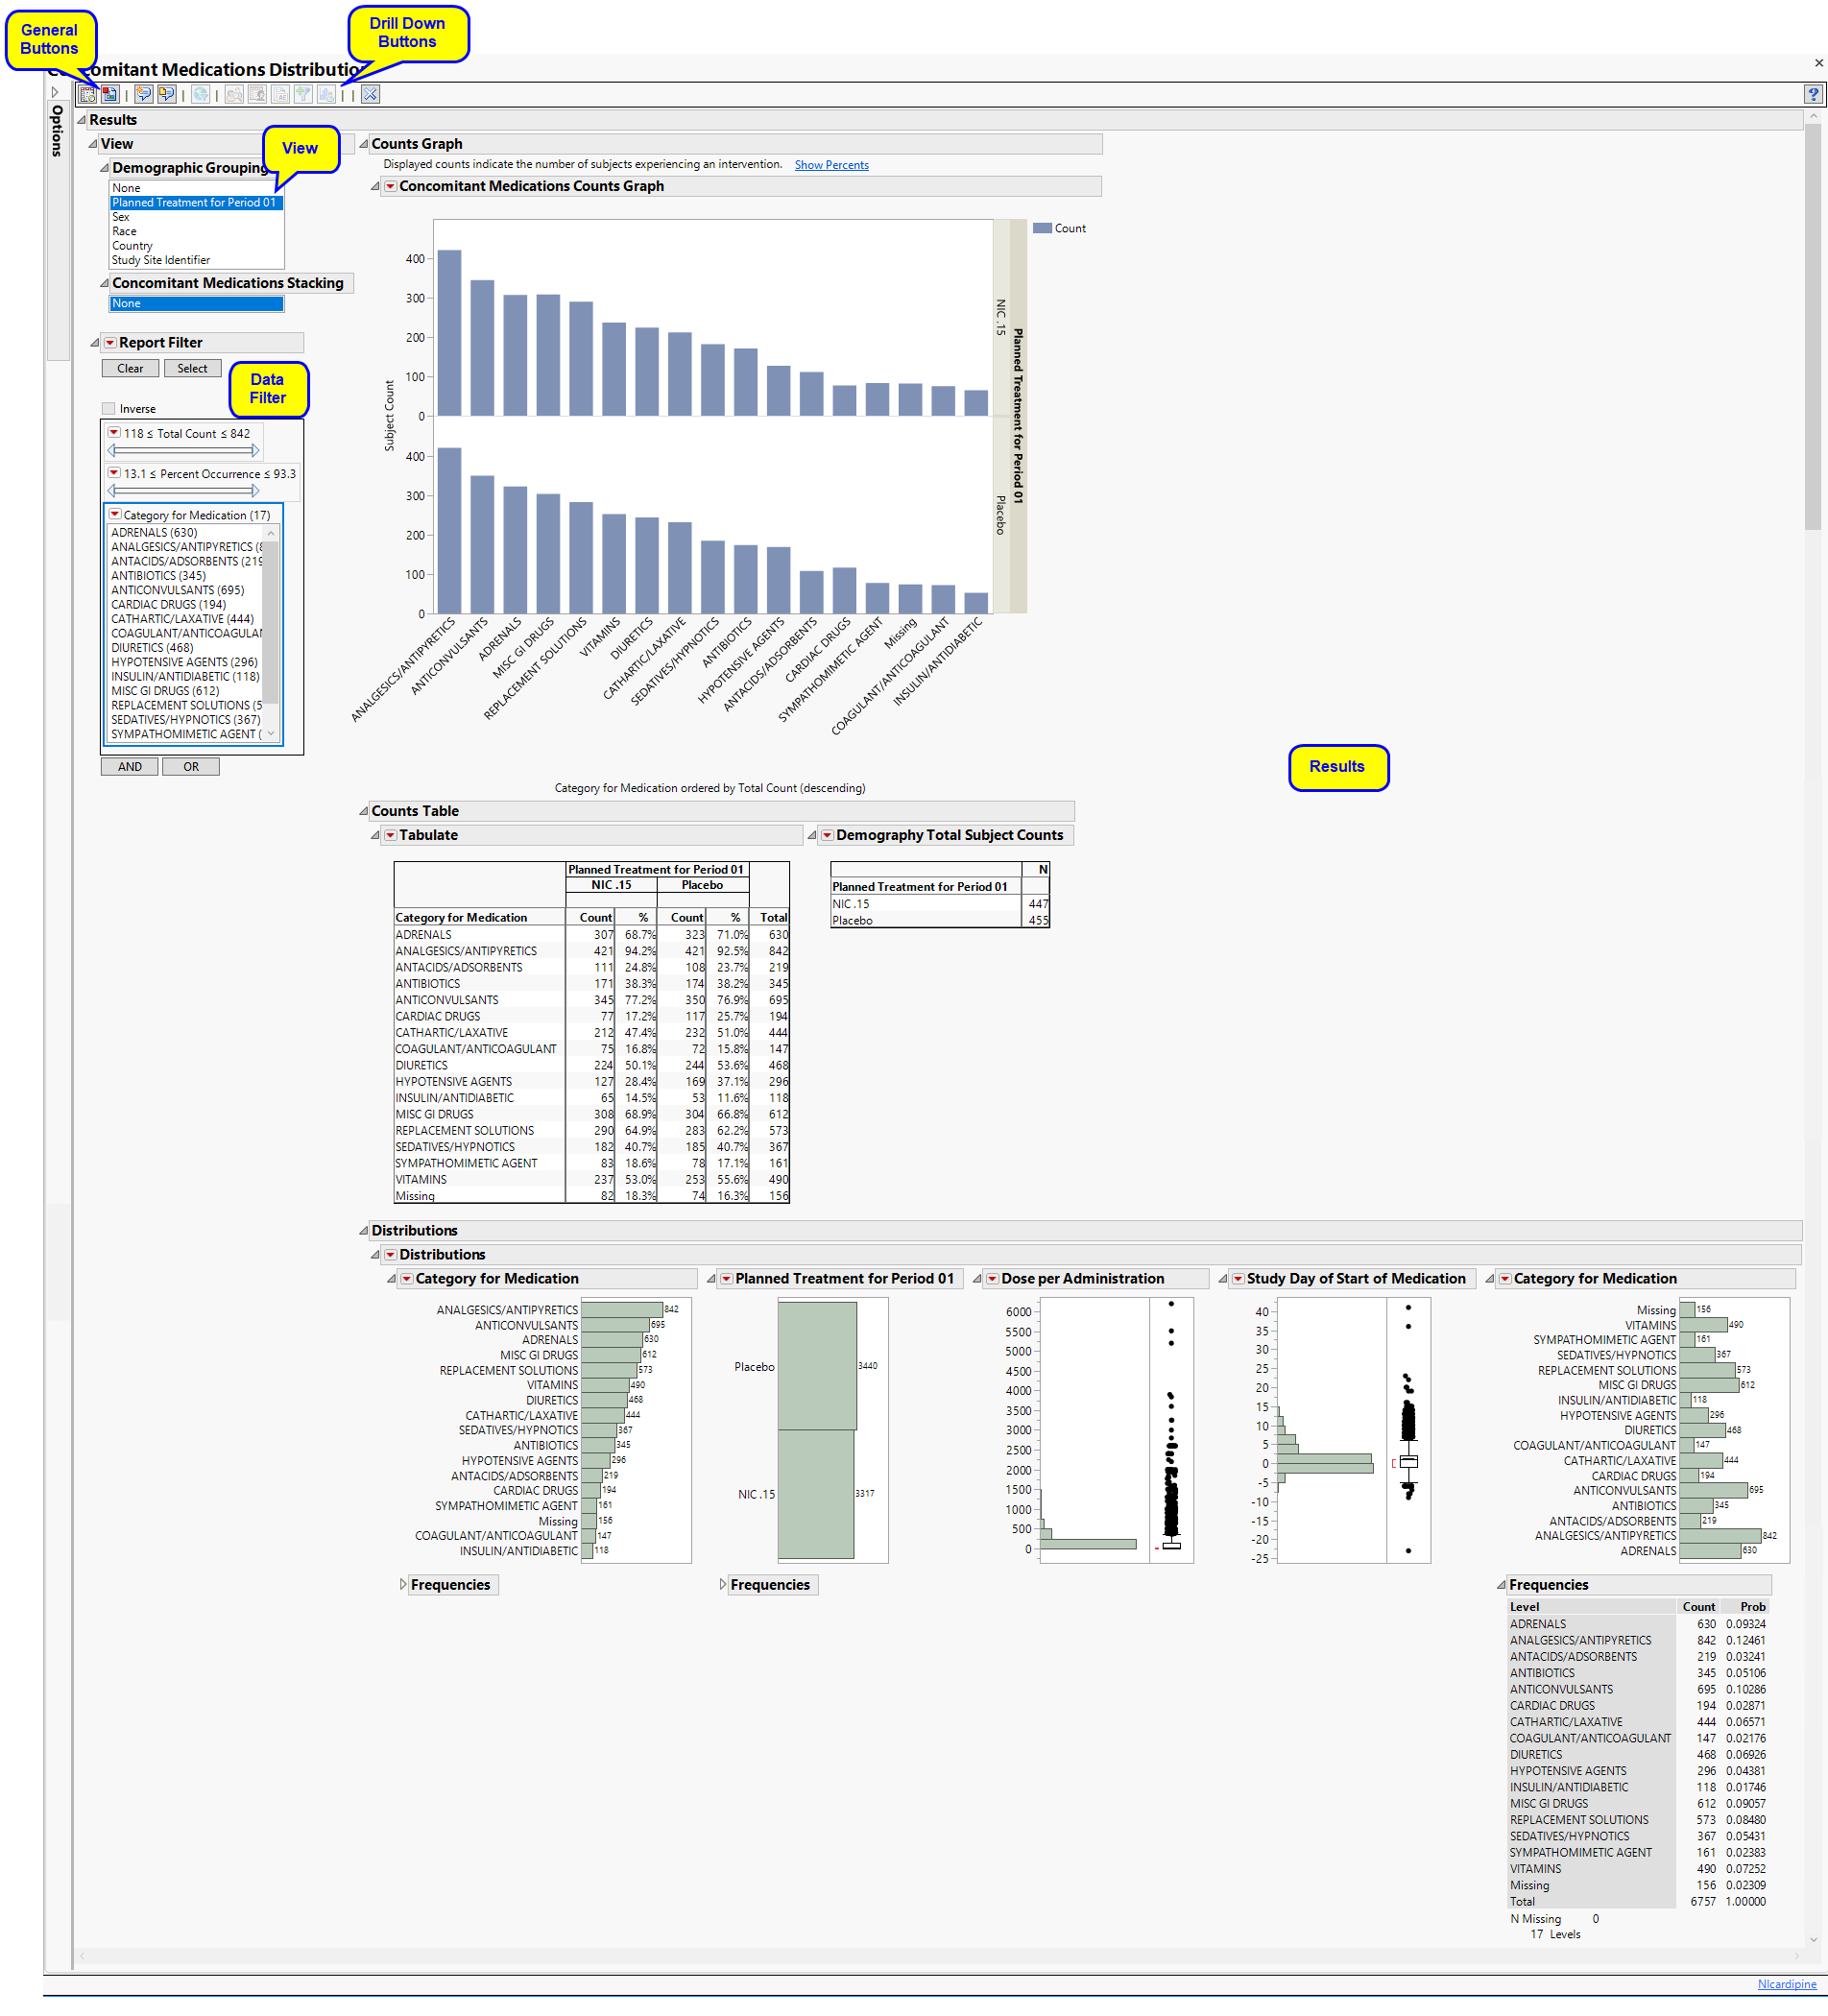
Running this report for Nicardipine using default settings generates the report shown below.
Refer to the AE Distribution output description, which notes areas where Interventions Distribution differs from AE Distribution, keeping in mind the following important differences in contrast with the example:
|
•
|
output (including section names) reflects concomitant medication or substance, rather than adverse event, incidence
|
|
•
|
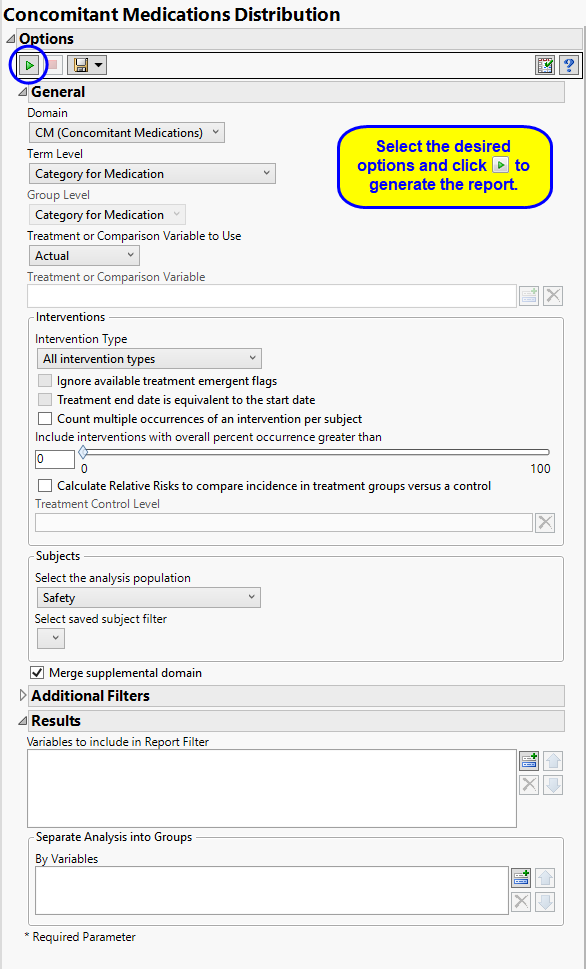
Use the Domain option to specify whether to plot the distribution of either concomitant medication (CM) or exposure (EX) interventions.
Term and Group Levels are determined by the coding dictionary for the Event or Intervention domain of interest, typically these levels follow the MedDRA dictionary. You must indicate how each adverse event is named and the level at which the event is considered. For example, selecting Reported Term and Body System or Organ Class as the Term Level and Group Level, respectively, reports the event specified by the actual event term as reported in the CM domain on the affected organ or body system.
The primary goal of clinical trials is to distinguish treatment effects when reporting and analyzing trial results. Treatments are defined by specific values in the treatment or comparison variables of the CDISC models. These variables are specified in this report using the Treatment or Comparison Variable to Use andTreatment or Comparison Variable options.
Available variables include Planned, which is selected when the treatments patients received exactly match what was planned and Actual, which is selected when treatment deviates from what was planned.
You can also specify a variable other than the ARM or TRTxxP (planned treatment) or ACTARM or TRTxxA (actual treatment) from the CDISC models as a surrogate variable to serve as a comparator. Finally you can select None to plot the data without segregating it by a treatment variable.
By default, all interventions are included in the analysis. However, you can choose to consider only those that emerge at specific times before, during, or after the trial period. For example, selecting On treatment events as the Intervention Type includes only those events that occur on or after the first dose of study drug and at or before the last dose of drug (+ the offset for end of dosing).
If you choose to Ignore available treatment emergent flags, the analysis includes all adverse events that occur on or after day 1 of the study.
When the end of treatment date is not known, check the Treatment end date is equivalent to the start date box to use the treatment start date to impute treatment end date, implying all treatment doses start and end the same day.
By default, the number of occurrences of an intervention is computed as the number of subjects experiencing that intervention, regardless of how many times each subject experienced the intervention. When a patient experiences multiple occurrences of an intervention, the software selects the occurrence for analysis based first on whether it is a serious intervention, then by severity and finally by time. When the Count multiple occurrences of an intervention per subject check box is checked, the counts reported for each event represent the total of all the occurrences of that event.
Use the Include interventions with overall percent occurrence greater than option to specify a threshold for reporting interventions. Only interventions that occur above the entered threshold (in terms of overall percent of occurrence) are displayed in the reports. This value is set to 0 by default, so that all intervention occurrences are included.
The Calculate Relative Risks to compare incidence in treatment groups versus a control and Treatment Control Level options are used in conjunction to compute the relative risk of experiencing each intervention for those subjects receiving the experimental treatment compared to the specified control group.
Filters enable you to restrict the analysis to a specific subset of subjects and/or interventions, based on values within variables. You can also filter based on population flags (Safety is selected by default) within the study data.
If there is a supplemental domain (SUPPCM or SUPPEX) associated with your study, you can opt to merge the non-standard data contained therein into your data.
See Select the analysis population, Select saved subject Filter1, Merge supplemental domain, Include the following interventions:, Filter to Include Interventions, and Additional Filter to Include Subjects2 or more information.
Use the Variables to include in Report Filter option to specify the variables to be included in the report data filter.
You can also subdivide the subjects and run analyses for distinct groups by specifying one or more By Variables.
Subject-specific filters must be created using the Create Subject Filter report prior to your analysis.
For more information about how to specify a filter using this option, see The SAS WHERE Expression.