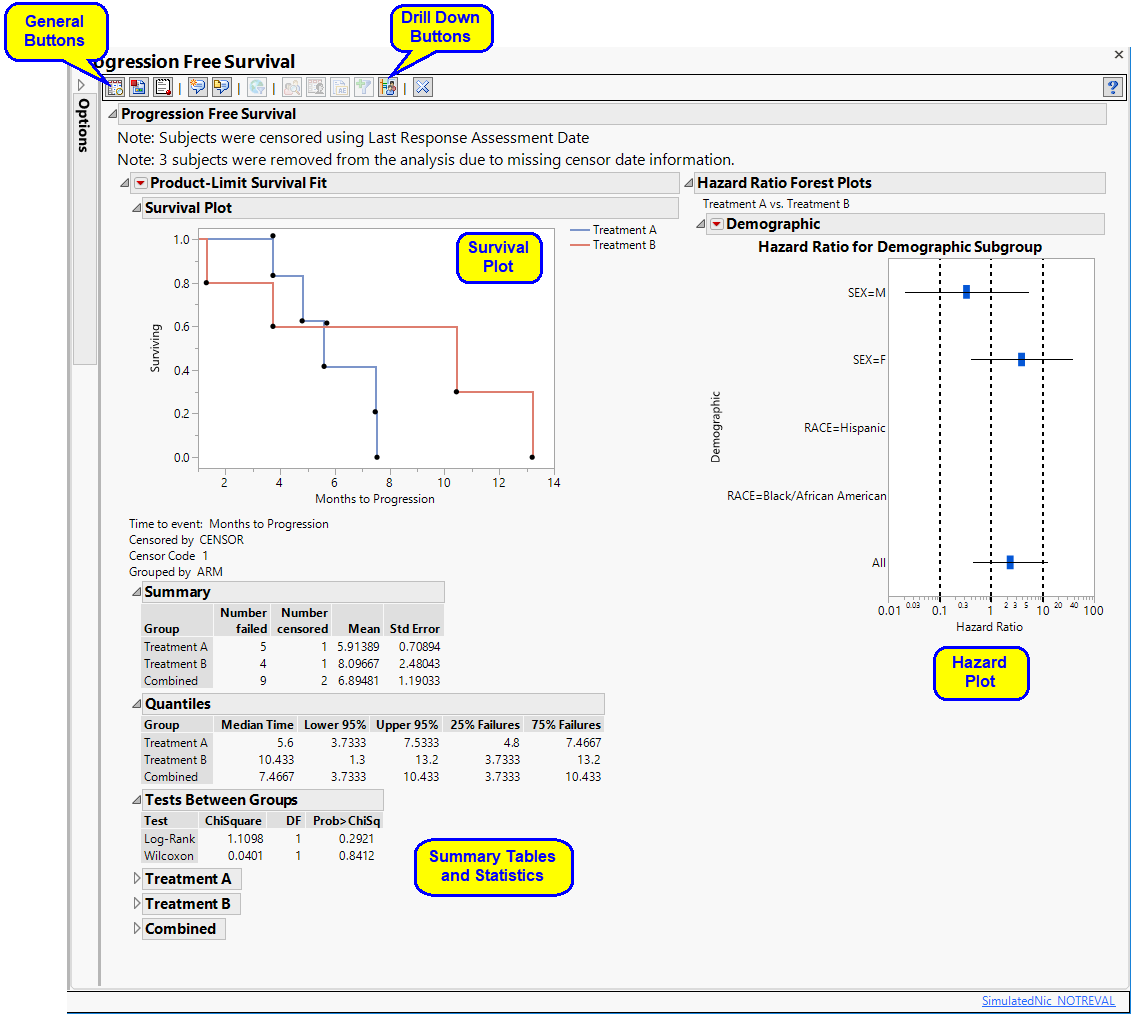
Running this report for a modified Nicardipine study using default settings generates the report shown below.
|
•
|
One Survival Plot
|
|
•
|
One Hazard Ratio Event Plot
|
Each blue rectangle represents the overall ratio for all patients in the group. Horizontal bars represent the 95% confidence interval. The ratios are plotted on a log-scale; a ratio of 1 is equivalent to no difference in hazard rates between the two treatments. Ratios greater than one show increased hazard rates resulting from treatment 1, whereas ratios less than one show increased hazard rates resulting from treatment 2.
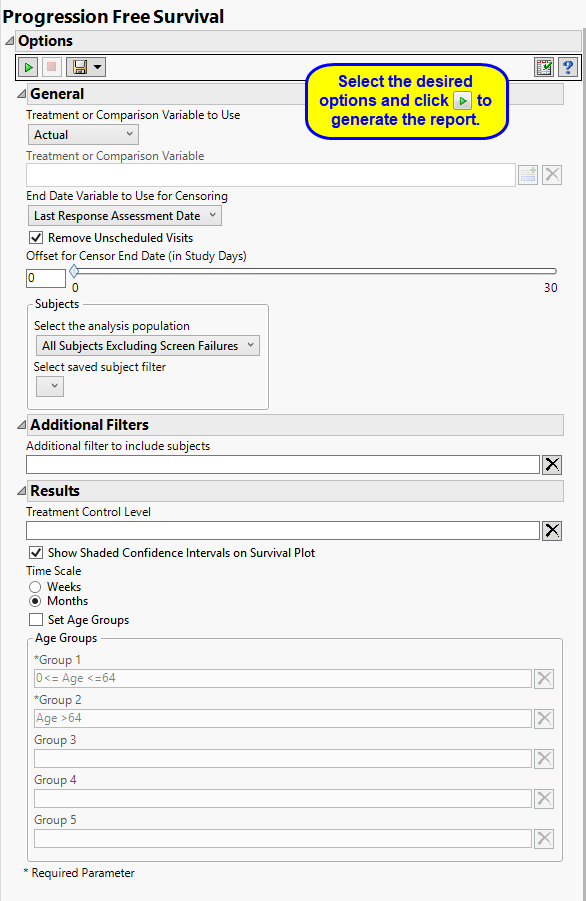
The primary goal of clinical trials is to distinguish treatment effects when reporting and analyzing trial results. Treatments are defined by specific values in the treatment or comparison variables of the CDISC models. These variables are specified in this report using the Treatment or Comparison Variable to Use andTreatment or Comparison Variable options.
Available variables include Planned, which is selected when the treatments patients received exactly match what was planned and Actual, which is selected when treatment deviates from what was planned.
You can also specify a variable other than the ARM or TRTxxP (planned treatment) or ACTARM or TRTxxA (actual treatment) from the CDISC models as a surrogate variable to serve as a comparator.
For patients who survive progression-free beyond the end of the study, the ultimate progression-free survival values for these individuals are unknown. All that can be said is that progression-free survival exceeds the period of the study; these data are considered censored. For these cases, you must specify the end date for collecting data to assess progression. The End Date Variable to Use for Censoring option is used to select which variable date reference from the demography domain to use for calculating the censored disease progression values. Patients who progress after this date are not considered as progressing. The Last Response Assessment Date is chosen by default.
Unscheduled visits can occur for a variety of reasons. By default, these are excluded from this analysis. However, by unchecking the Remove unscheduled visits box, you have the option of including them.
The Offset for Censor End Date (in Study Days) option enables you to specify a minimum time interval following censor end date that can be used to determine whether progression has occurred. Patient who progress within that threshold are considered to have progressed whereas patients who progress after the specified threshold are not.
SeeSelect the analysis population, Select saved subject Filter, and Additional Filter to Include Subjects, for more information.
The Treatment Control Level is specified as either “Placebo” or “Pbo”, depending on the value found in your data, by default. However, if your control is defined differently you can use the text box to specify how the control level is identified in your study.
Selecting the Show Shaded Confidence Intervals on Survival Plot option adds confidence intervals to the plots.
By default, time is measured in months. However, you can change the Time Scale to plot time in either months or weeks. This option is useful for assessing report graphics for exceptionally long studies.
Factors other than treatment can influence mortality of study subjects. For example, elderly subjects might be more likely to die during or soon after participating in the study. By default, this report does not consider subject age in the analysis. However, this report enables you to Set Age Groups in order to assess subject age on mortality rates in up to 5 age groups observed in your study. See Group 1, Group 2, Group 3, Group 4, Group 5 for more information.