This report generates SAS reports of adverse event counts and percentages by treatment arms, sex, and race, and are organized by body system. All tables are consistent with the ICH E3 guidelines on the structure and contents of clinical reports
Running this report for the Nicardipine study generates a PDF, and/or rtf file summary of the adverse events experienced by the subjects in the trial grouped by treatment, gender and race. The inclusion of an additional table showing counts of each adverse event by severity level can be specified.
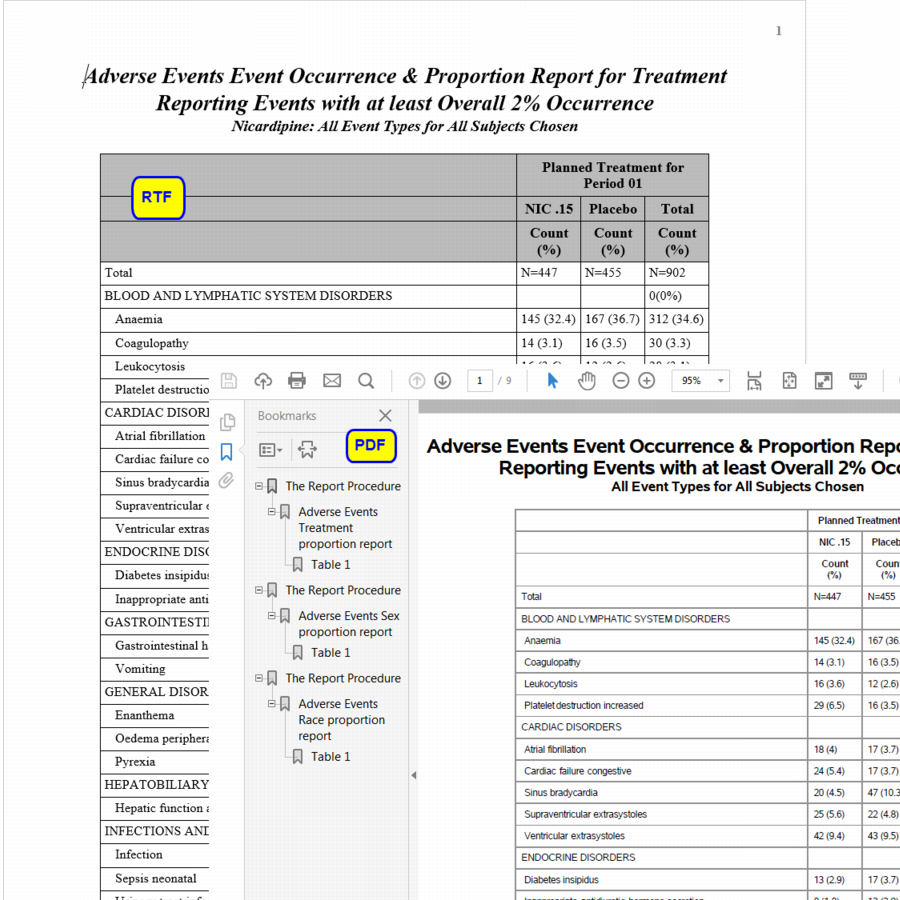
The PDF format also contains hyperlinks in their left pane for ease of navigation to specific reports.
Note: Adverse events must meet or exceed the specified threshold occurrence to be included.
Note: For information about how treatment emergent adverse events (TEAEs) are defined in JMP Clinical, please refer to How does JMP Clinical determine whether an Event Is a Treatment Emergent Adverse Event?.
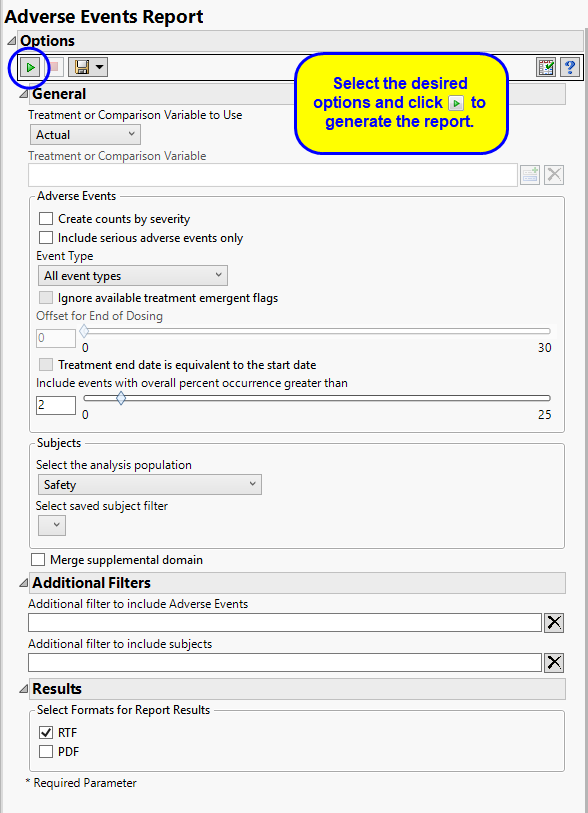
The primary goal of clinical trials is to distinguish treatment effects when reporting and analyzing trial results. Treatments are defined by specific values in the treatment or comparison variables of the CDISC models. These variables are specified in this report using the Treatment or Comparison Variable to Use andTreatment or Comparison Variable options.
Available variables include Planned, which is selected when the treatments patients received exactly match what was planned and Actual, which is selected when treatment deviates from what was planned.
You can also specify a variable other than the ARM or TRTxxP (planned treatment) or ACTARM or TRTxxA (actual treatment) from the CDISC models as a surrogate variable to serve as a comparator. Finally you can select None to plot the data without segregating it by a treatment variable.
By default, this report generates several tables reporting the percent occurrence of adverse effects by treatment arm. No information about the severity of these effects is provided in these tables. The Create Counts by Severity option enables you to generate an additional table listing the adverse events and indicating the numbers (counts) of subjects in each arm experiencing mild, moderate, or severe events.
By default, all events are included in the analysis. However, you can opt to include only those considered serious. Selecting the Include serious adverse events only option restricts the analysis to those adverse events defined as Serious under FDA guidelines.
Analysis can consider all events or only those that emerge at specific times before, during, or after the trial period. For example, selecting On treatment events as the Event Type includes only those events that occur on or after the first dose of study drug and at or before the last dose of drug (+ the offset for end of dosing).
If you choose to Ignore available treatment emergent flags, the analysis includes all adverse events that occur on or after day 1 of the study.
By default, post-treatment monitoring begins after the patient receives the last treatment. However, you might want to specify an Offset for End of Dosing, increasing the time between the end of dosing and post-treatment monitoring for treatments having an extended half-life.
When the end of treatment date is not known, check the Treatment end date is equivalent to the start date box to use the treatment start date to impute treatment end date, implying all treatment doses start and end the same day.
Use the Include events with overall percent occurrence greater than option to specify a threshold for reporting adverse events. Only events that occur above the entered threshold (in terms of overall percent of occurrence) are displayed in the reports. This value is set to 2 by default.
Filters enable you to restrict the analysis to a specific subset of subjects and events based on values within variables. You can also filter based on population flags (Safety is selected by default) within the study data.
If there is a supplemental domain (SUPPAE) associated with your study, you can opt to merge the non-standard data contained therein into your data.
See Select the analysis population, Select saved subject Filter1, Merge supplemental domain, Additional Filter to include Adverse Events, and Additional Filter to Include Subjects, for more information.
Subject-specific filters must be created using the Create Subject Filter report prior to your analysis.