This report shows the distribution of the review status of subjects in a study.
Before you can run this report, you must have identified and analyzed data from patients of interest, and indicated review status using the Profile Subjects report.
Running this report for the Nicardipine sample setting generates the report shown below.
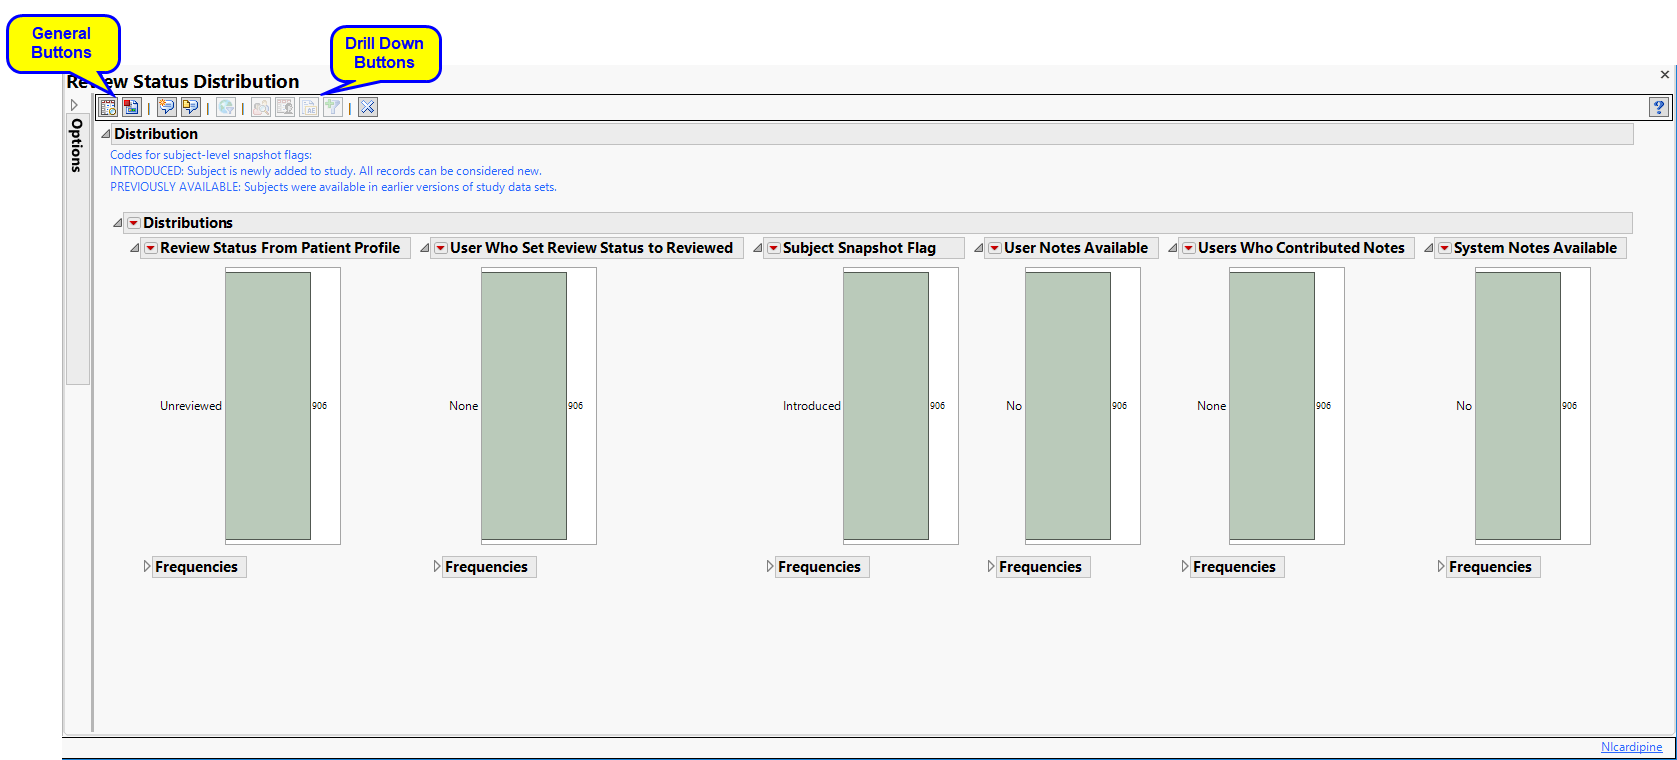 [
[The Distribution section contains the following elements:
|
•
|
Six Histograms, detailing counts and proportions for review status (reviewed or unreviewed) and who set that status, review flag (introduced, new record, modified record, or stable), and availability of user and system notes, including who contributed the notes.
|
Review status can be changed when reviewing subjects from the Patient Profiler. In this example, 4 out of 902 subjects (0.4%) have been reviewed in the Patient Profiler, all have been newly added to the review, none of them have user notes, and 100 subjects (11.1%) have system notes.
Note: The review flag of a reviewed subject who is found to have new or modified records with a snapshot update is switched to unreviewed.
Note: System notes are automatically generated to record the time stamp of study creation and modification events.
|
•
|
Profile Subjects: Select subjects and click
|
|
•
|
Show Subjects: Select subjects and click
|
|
•
|
Cluster Subjects: Select subjects and click
|
|
•
|
Demographic Counts: Select subjects and click
|
|
•
|
Click
|
|
•
|
Click
|
|
•
|
Click
|
|
•
|
Click
|
|
•
|
Click the arrow to reopen the completed report dialog used to generate this output.
|
|
•
|
Click the gray border to the left of the Options tab to open a dynamic report navigator that lists all of the reports in the review. Refer to Report Navigator for more information.
|
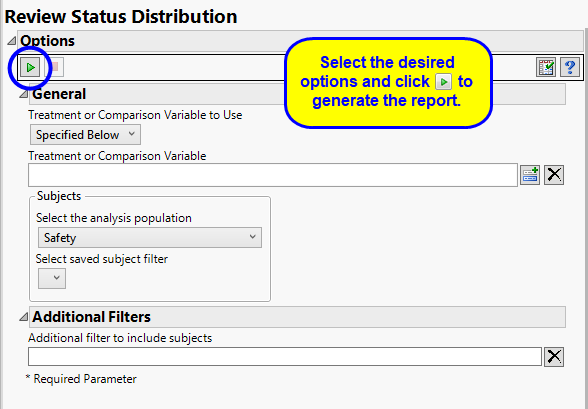
The primary goal of clinical trials is to distinguish treatment effects when reporting and analyzing trial results. Treatments are defined by specific values in the treatment or comparison variables of the CDISC models. These variables are specified in this report using the Treatment or Comparison Variable to Use andTreatment or Comparison Variable options.
Available variables include Planned, which is selected when the treatments patients received exactly match what was planned and Actual, which is selected when treatment deviates from what was planned.
You can also specify a variable other than the ARM or TRTxxP (planned treatment) or ACTARM or TRTxxA (actual treatment) from the CDISC models as a surrogate variable to serve as a comparator. Finally you can select None to plot the data without segregating it by a treatment variable.
Note: Subjects not meeting filtering criteria remain in the domains but notes associated with them are not surfaced in the viewer.
Subject-specific filters must be created using the Create Subject Filter report prior to your analysis.