Box Plot
A box plot (also known as a box-and-whisker plot) provides information about the mean, variability, outliers, and symmetry of the distributions of your data.
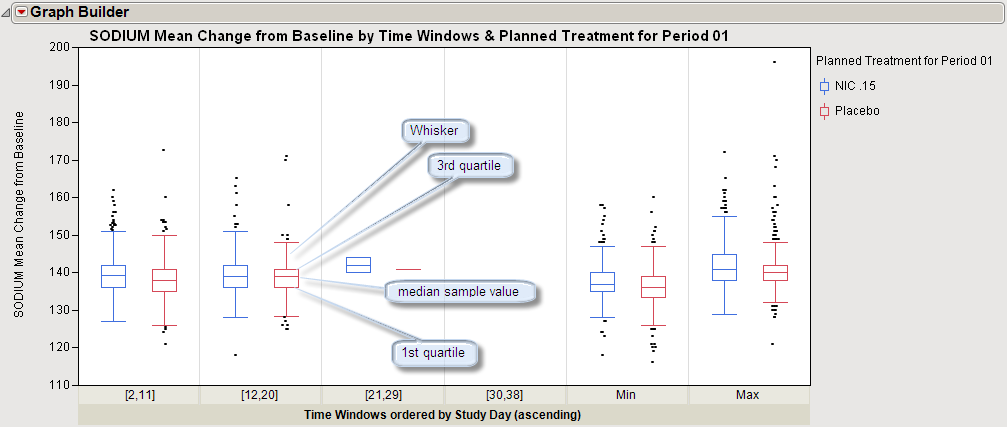
Note the following aspects of box plots:
| • | The plot consists of a box that extends from the 25th quantile (also known as the first (Q1) quartile) to the 75th quantile (also known as the third (Q3) quartile). |
| • | The horizontal line within each box indicates the sample median. |
| • | The difference between the 1st and 3rd quartiles is called the interquartile range. |
| • | The box has lines that extend from each end, sometimes called whiskers. The whiskers extend from the ends of the box to the outermost data point that falls within the distances computed as follows: |
1st quartile - 1.5*(interquartile range)
3rd quartile + 1.5*(interquartile range)
| • | If the data points do not reach the computed ranges, then the whiskers are determined by the upper and lower data point values (not including outliers). |
| • | Points outside of the whiskers are outliers. |