Derived Population Flags
Enable you to separate subjects into two groups, based on whether they meet or do not meet one or more specified criteria, for comparing the effect of the specified criteria on other features.
In the following example, using the Nicardipine sample data, we compare the distributions of adverse events in subjects suffering from hypotension and phlebitis and those not suffering from these conditions.
In the first step, we ran the Adverse Events Distribution report on the Nicardipine study using the default settings. These include having Planned specified as the Treatment or Comparison Variable to Use.
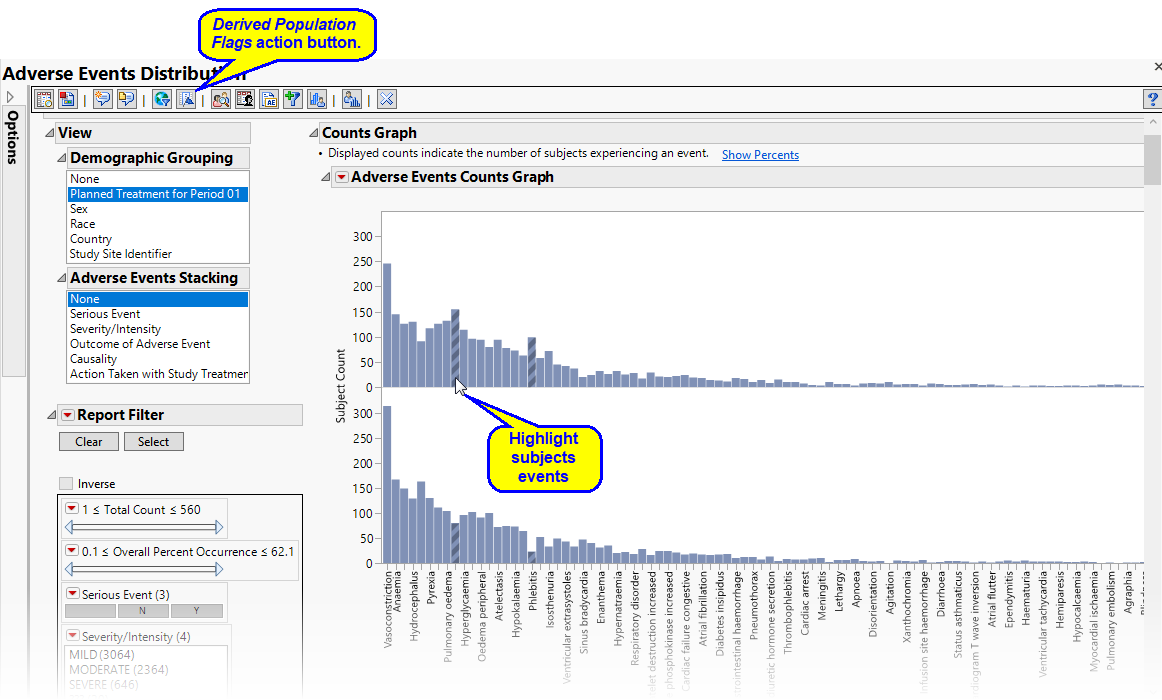
Both hypotension and phlebitis occurred with relatively higher frequency than other events among patients receiving Nicardipine than in those receiving a placebo. These events were selected for both treatment groups.
Clicking  opens the Add window, shown below.
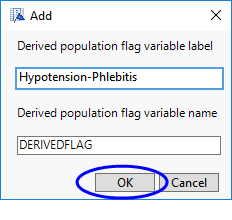
Hypotension-Phlebis was specified as a label for the flag. The default variable name DERIVEDFLAG was used. Clicking added a flagged variable to the data set called DERIVEDFLAG . Values for this variable are either Y if a subject is exhibits either hypotension or phlebitis or N, if a subject does not. It is also possible for a derived flag to have missing values. This will happen if the report in which selections are being made is run with a subject filter.
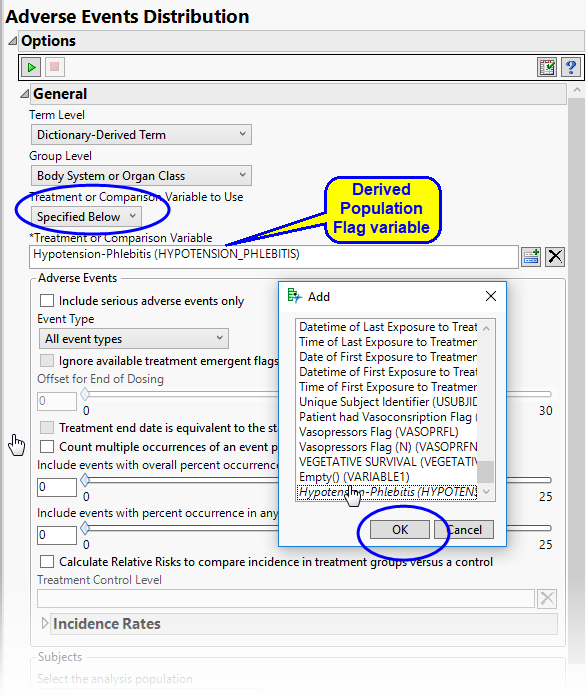
The report was run a second time. However, the Treatment or Comparison Variable to Use was changed to Specified Below. and the new Hypotension-Phlebitis derived flag variable was specified as the Treatment or Comparison Variable.
The results of this second run are shown below:
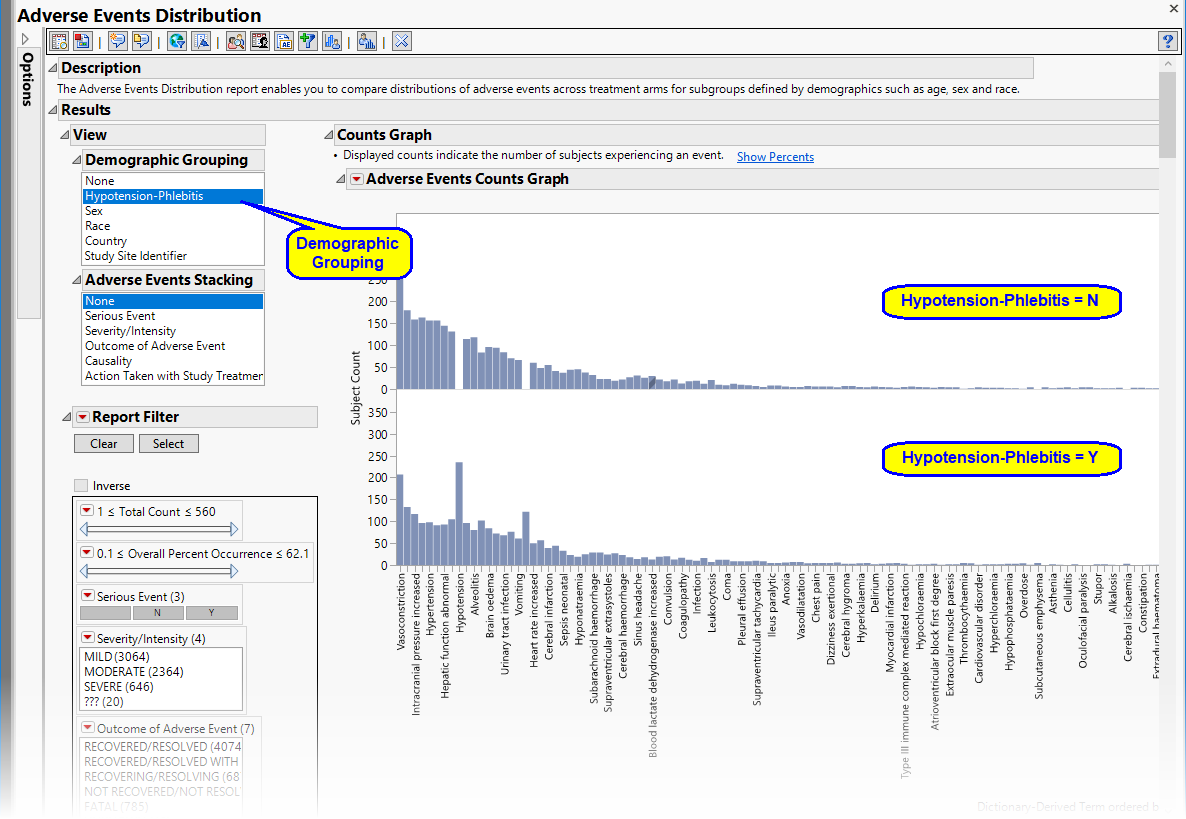
The distributions of the events for each demographic group (subjects exhibiting the flagged effects vs. subjects not exhibiting these effects) are shown. The groups can be compared and further explored.