Hy’s Law Time Course Plot
This plot shows the relationship between peak liver lab test values and study day of specimen collection for a specific subject.
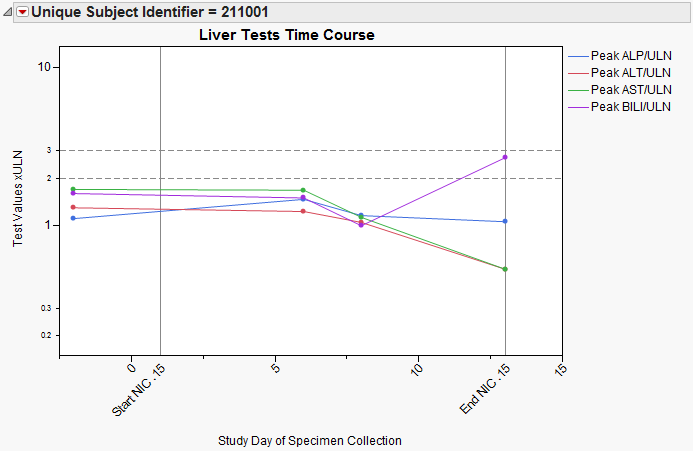
In this example, subject 211001 treated with Nicardipine .15 exhibited higher peak BILI/ULN and lower peak ALT/ULN compared to measurements taken prior to the first dose.