One-way Plot
A one-way plot, which is generated by the JMP Fit Y by X platform, shows the response points along the Y axis for each X factor value. Using the plot, you can compare the distribution of the response across the levels of the X factor. The distinct values of X are sometimes called levels.
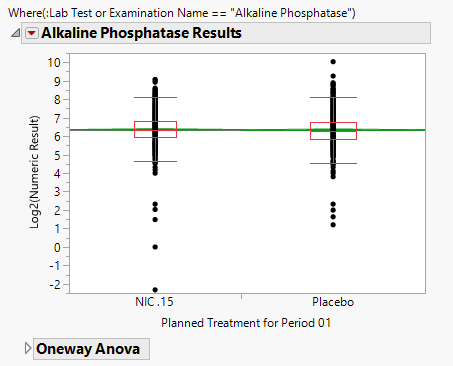
The one-way plot below shows the relative response of alkaline phosphatase levels in patients treated with either nicardipine or a placebo.
Refer to Box Plot for more information.