Standard Safety Reports
This report generates selected standard safety reports on the population meeting the specified filter criteria, in the format(s) specified (RTF or PDF file).
Report Results Description
The selected standard safety reports are generated in the specified format (RTF or PDF).
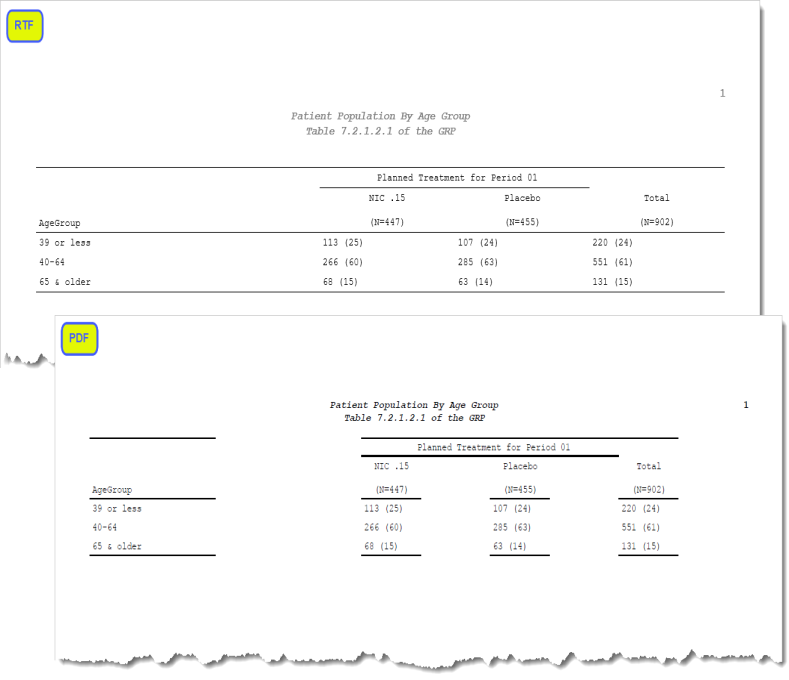
Thefigure above shows the first data page of the RTF and PDF report output.
Table of Contents (RTF only)
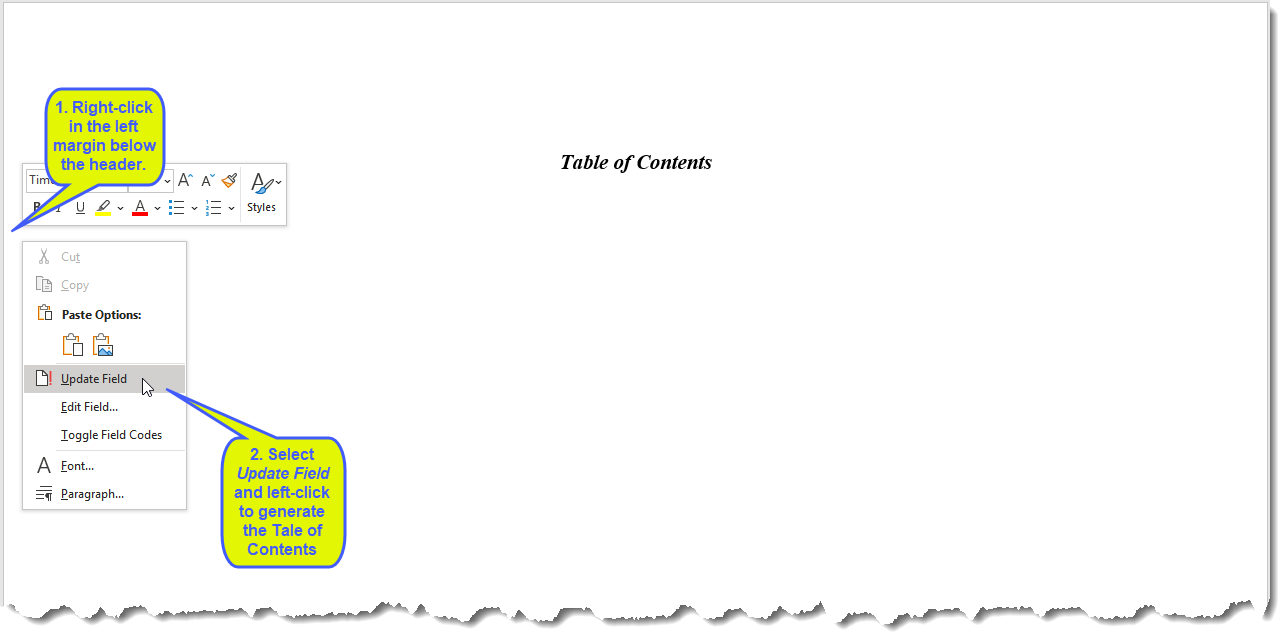
Initially, the Table of Contents page (first page)of the RTF is blank, except fot the Table of Contents heading. To generate a Table of Contents for the RTF version of the report, complete the steps outlined in the following figure.
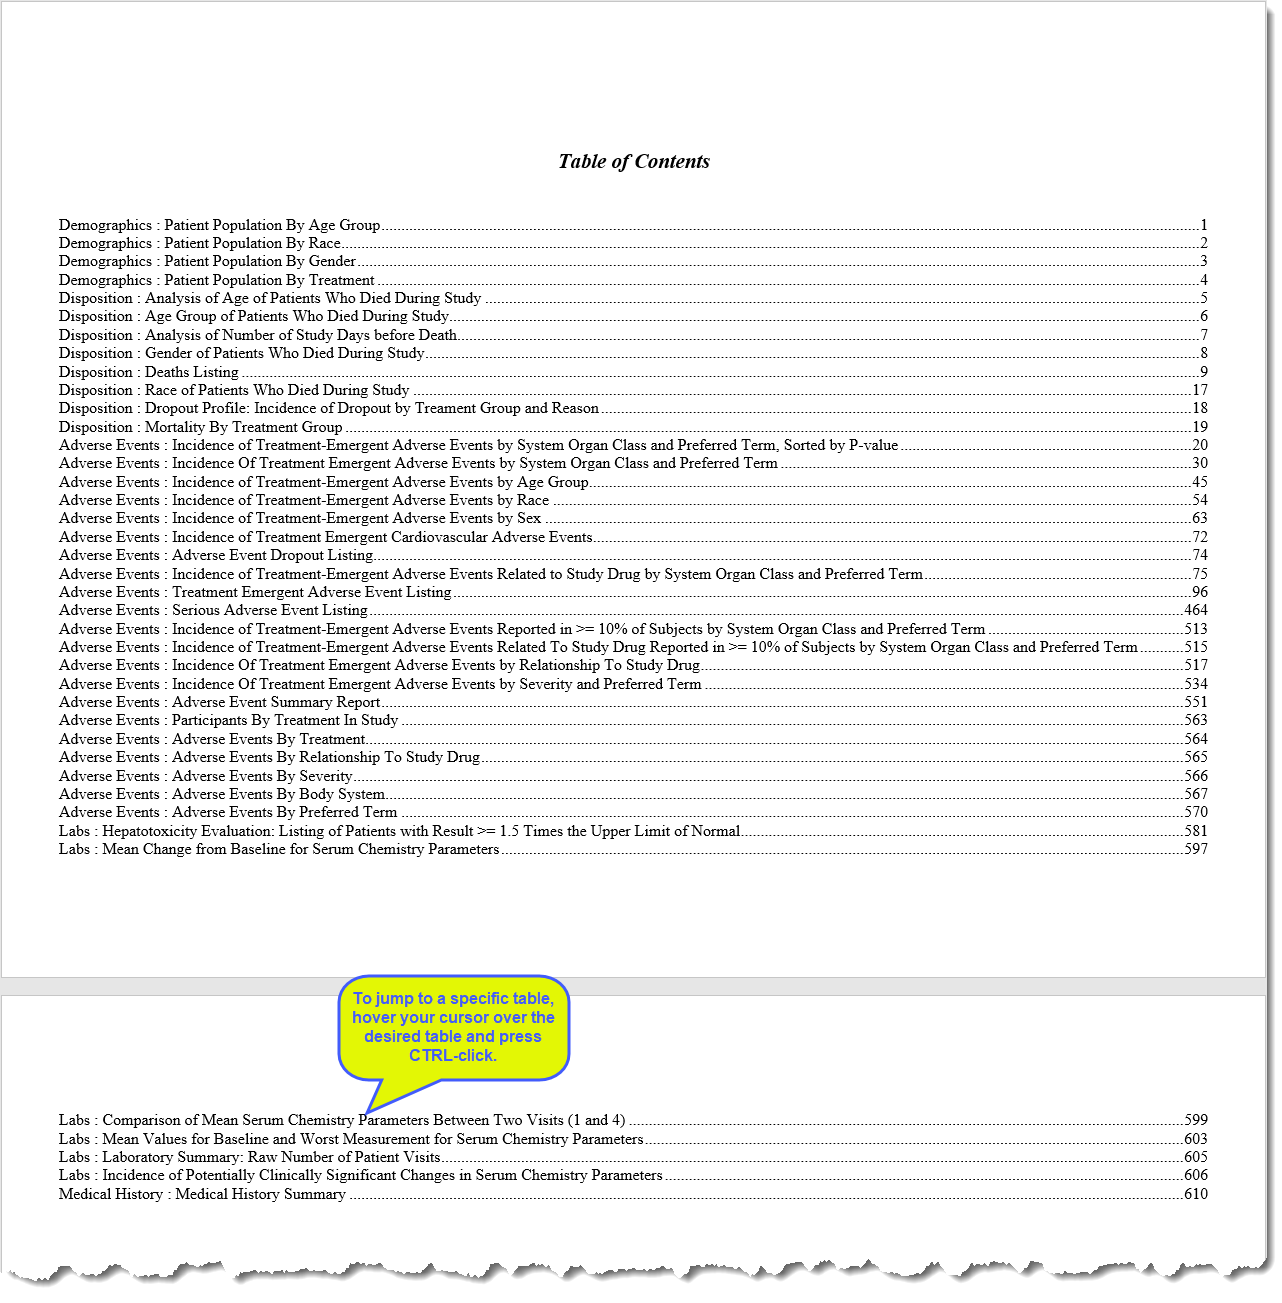
The Table of Contents, listing and containing links to each of the tables in the report, is generated and surfaced, as shown below:
Report Options
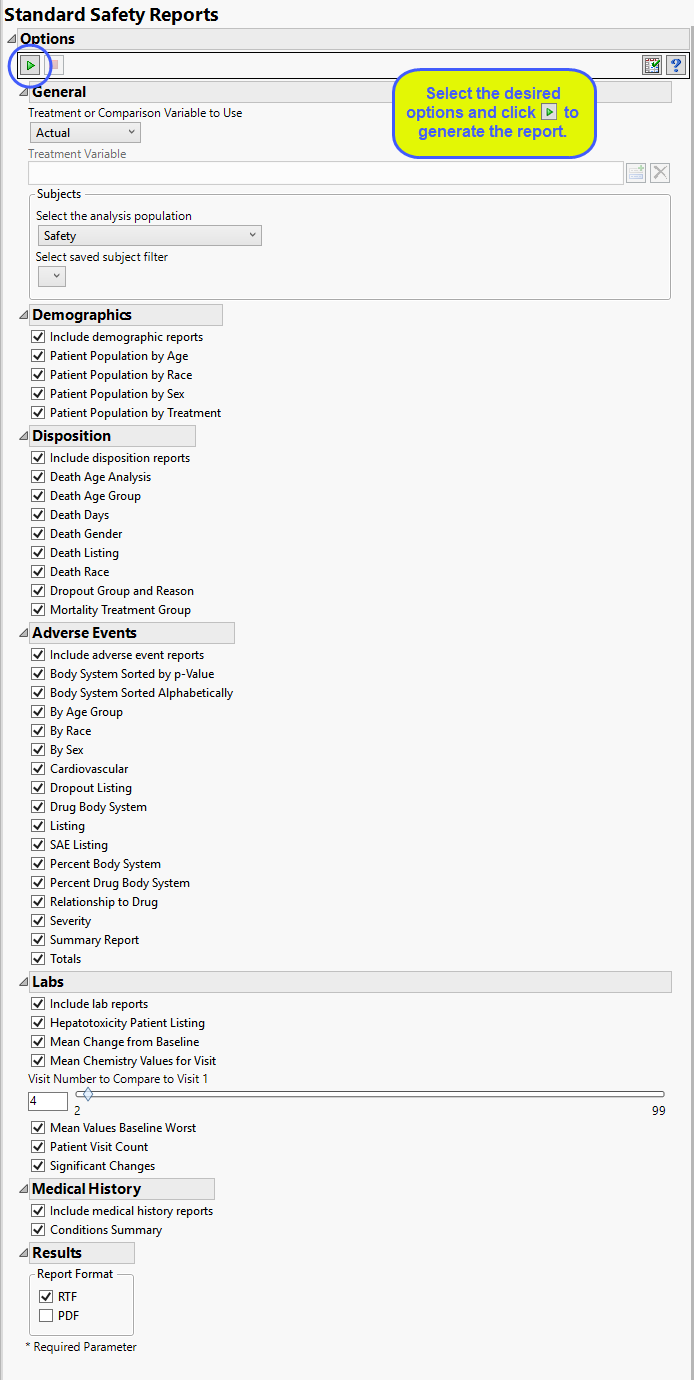
Setting Up Treatment or Comparison Variable:
The primary goal of clinical trials is to distinguish treatment effects when reporting and analyzing trial results. Treatments are defined by specific values in the treatment or comparison variables of the CDISC models. These variables are specified in this report using the Treatment or Comparison Variable to Use andTreatment or Comparison Variable options.
Distributions of the specified treatment or comparison variables are shown in the output.
Available variables include Planned, which is selected when the treatments patients received exactly match what was planned and Actual, which is selected when treatment deviates from what was planned.
You can also specify a variable other than the ARM or TRTxxP (planned treatment) or ACTARM or TRTxxA (actual treatment) from the CDISC models as a surrogate variable to serve as a comparator. Finally, you can select None to plot the data without segregating it by a treatment variable.
See Treatment or Comparison Variable to Use, Treatment or Comparison Variable for more information.
excluded from the analysis.
Filtering the Data:
Filters enable you to restrict the analysis to a specific subset of subjects, based on values within variables. You can also filter based on population flags (Safety is selected by default) within the study data.
See Select the analysis population, and Select saved subject filter, for more information.
Demographics
You can opt to Include demographic reports in the safety report. Separate tables listing count and percentile data for each study arm for Patient Population by Age, Patient Population by Race, Patient Population by Sex’, or Patient Population by Treatment can be generated.
Disposition
You can opt to Include disposition reports in the safety report.
Selecting Death Age Analysis generates a table listing age statistics (max, mean, min, number, and standard deviation) by treatment arm of the patients who died during the study.
Selecting Death Age Group generates a table listing count and percentile data for each study arm by age group for patients who died during the study.
Selecting Death Days generates a table listing age statistics (max, mean, min, number, and standard deviation) by treatment arm for the number of study stays before patients died.
Selecting Death Gender generates a table listing count and percentile data for each study arm by gender for patients who died during the study.
Selecting Death Listing generates a table listing the trial number, study site, subject ID age, gender, treatment arm, and death day for each patient who died during the study.
Selecting Death Race generates a table listing count and percentile data for each study arm by race for patients who died during the study.
Selecting Dropout Group and Reason generates a table listing the dropout group and reason statistics for the patients. This box is checked by default.
Selecting Mortality Treatment Group generates a table listing the number of patients, the number who died, and the mortality rate for each treatment ARM.
Adverse Events
You can opt to Include adverse event reports in the safety report.
Note: This option and all subordinate options are selected by default.
Selecting Body System Sorted by p-Value generates a table listing counts and percentiles of patients experiencing adverse events (AE) differentiated by study ARM and system organ class and preferred term. AEs are sorted from p-value to high.
Selecting Body System Sorted Alphabetically generates a table listing counts and percentiles of patients experiencing adverse events (AE) differentiated by study ARM and system organ class and preferred term. AEs are sorted alphabetically.
Selecting By Age Group generates a table listing that lists Adverse Events statistics (counts and percentiles) for the patients by age group.
Selecting By Race generates a table listing that lists Adverse Events statistics (counts and percentiles) for the patients by race.
Selecting By Sex generates a table listing that lists Adverse Events statistics (counts and percentiles) for the patients by gender.
Selecting Cardiovascular generates a table listing that lists TEAE cardiovascular statistics (counts and percentiles) by treatment ARM for the patients.
Selecting Dropout Listing generates a table listing that lists Adverse Events dropout statistics (counts and percentiles) by treatment ARM for the patients who leave the study prematurely.
Selecting Drug Body System generates a table listing that lists Adverse Events statistics (counts and percentiles) by treatment ARM describing the effects of the drugs on the patients’ body systems.
Selecting Listing generates a table that lists demographics, treatment ARM, and treatment emergent Adverse Events statistics for each patient in the study. Statistics reported include number of days, body systems affected, preferred term for the event, described term, whether the TEAE was serious, the outcome and whether the patient withdrew from the study.
Selecting SAE Listing generates a table that lists demographics, treatment ARM, and serious Adverse Events statistics for each patient in the study. Statistics reported include number of days, body systems affected, preferred term for the event, described term, and whether the patient withdrew from the study.
Selecting Percent Body System generates a table that lists the incidence (counts and percentiles) by treatment ARM and system organ class of treatment emergent AEs occurring in at least10% of the subjects.
Selecting Percent Drug Body System generates a table that lists the incidence (counts and percentiles) by treatment ARM and system organ class of treatment emergent AEs related to the study drug(s) occurring in at least10% of the subjects.
Selecting Relationship to Drug generates a table that lists statistics (counts and percentiles) indicating whether there is a relationship between the AEs and the study drug(s) for the patients in the study.
Selecting Severity generates a table that lists Adverse Events severity statistics (counts and percentiles) for the patients in the study.
Selecting Summary Report generates a table summarizing the incidence of AEs (counts and percentiles) by treatment ARM and body system.
Selecting Totals generates a series of tables summarizing the number and distribution of study participants, the numbers, distributions, and severity of adverse events, their relationships to study drugs, and body systems affected
Labs
You can opt to Include lab reports in the safety report.
Note: This option and all subordinate options are selected by default.
Selecting Hepatotoxicity Patient Listing generates a table listing hepatotoxicity statistics for patients for each visit in which they exhibited values greater than 1.5 times the upper limit of normal for a particular laboratory result.
Selecting Mean Change from Baseline generates a table listing mean changes (numerical and percentage) from baseline lab values for all of the recorded lab tests.
Selecting Mean Chemistry Values for Visit generates a table listing the mean serum chemistry values for the first visit and a subsequent visit specified using the Visit Number to Compare to Visit 1 option, along with the differences between the two means.
Selecting Mean Values Baseline Worst generates a table comparing the mean values for each lab test with the worst values.
Selecting Patient Visit Count generates a table listing the raw number of patients attending each of the scheduled visits.
Selecting Significant Changes generates a table listing the incidence of potentially significant changes in laboratory values.
Medical History
You can opt to Include medical history reports in the safety report.
Note: This option and all subordinate options are selected by default.
Selecting Conditions Summary generates a table listing dictionary- derived relevant medical history terms and the number of patients in each treatment ARM that experienced those events.
Results
You can use the output options to specify the format (RTF or PDF) of the final report.