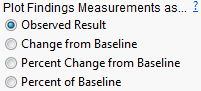
Plot findings measurements as:
Select the type of findings measurement values to plot.
Available options are listed in the following table:
|
Option |
Description |
|
Observed result |
Plots observed values of the xxSTRESN variable at or within time points or specified time periods. |
|
Change from baseline |
Plots the change from the findings baseline measurements (determined by the xxBLFL variable and/or a user-defined Baseline Time Window) and is calculated as xxSTRESN - Baseline. |
|
Percent change from baseline |
Plots 100*((xxSTRESN - Baseline)/Baseline) across trial time points. |
|
Percent of baseline |
Plots 100*(xxSTRESN/Baseline). |
To Specify the Measurement Type:
| 8 | Click within the appropriate radio button. |