Summary Statistics to Display in Tables
Select the summary statistics to display in the Findings tables.
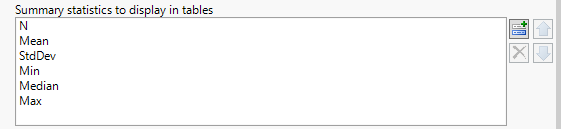
Default selections include number of samples, mean, standard deviation, minimum value, median, and maximum value.
Options are listed in the following table:
|
Summary Statistic |
Definition |
||||||
|
N |
|
||||||
|
Mean |
|
||||||
|
StdDev |
|
||||||
|
Min |
|
||||||
|
Median |
|
||||||
|
Max |
|
||||||
|
StdErr |
|
||||||
|
CV |
|
||||||
|
Quantiles(25) |
|
||||||
|
Quantiles(75) |
|
By default if nothing is selected the following statistics are shown: N, Mean, Std Dev, Min, Median, and Max.
To Select the Summary Statistics to Be Displayed:
| 8 | Click  to open the Add window that lists available statistics (shown below). to open the Add window that lists available statistics (shown below). |
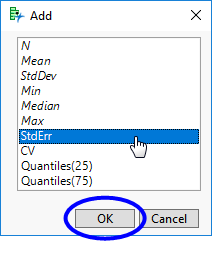
Note that the statistics already selected are in italics.
| 8 | Select the additional statistics you want to idisplayed and click to add those statistics to the text box. |
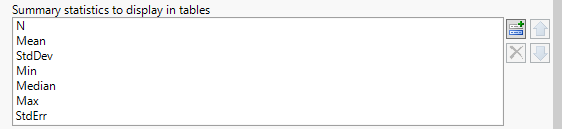
In this example, visits standard error was selected and added.
| 8 | To select multiple statistics, click on each desired statistic while pressing and holding the Ctrl key. |